3. Use the other controls to set the waveform interpolation algorithm, waveform point persistence, style, and intensity, and graticule style
and intensity.
4. Tap the Help icon on the menu title to open the Waveform View menu help topic for more information on the waveform view
parameters.
5. Tap outside the menu to close the menu.
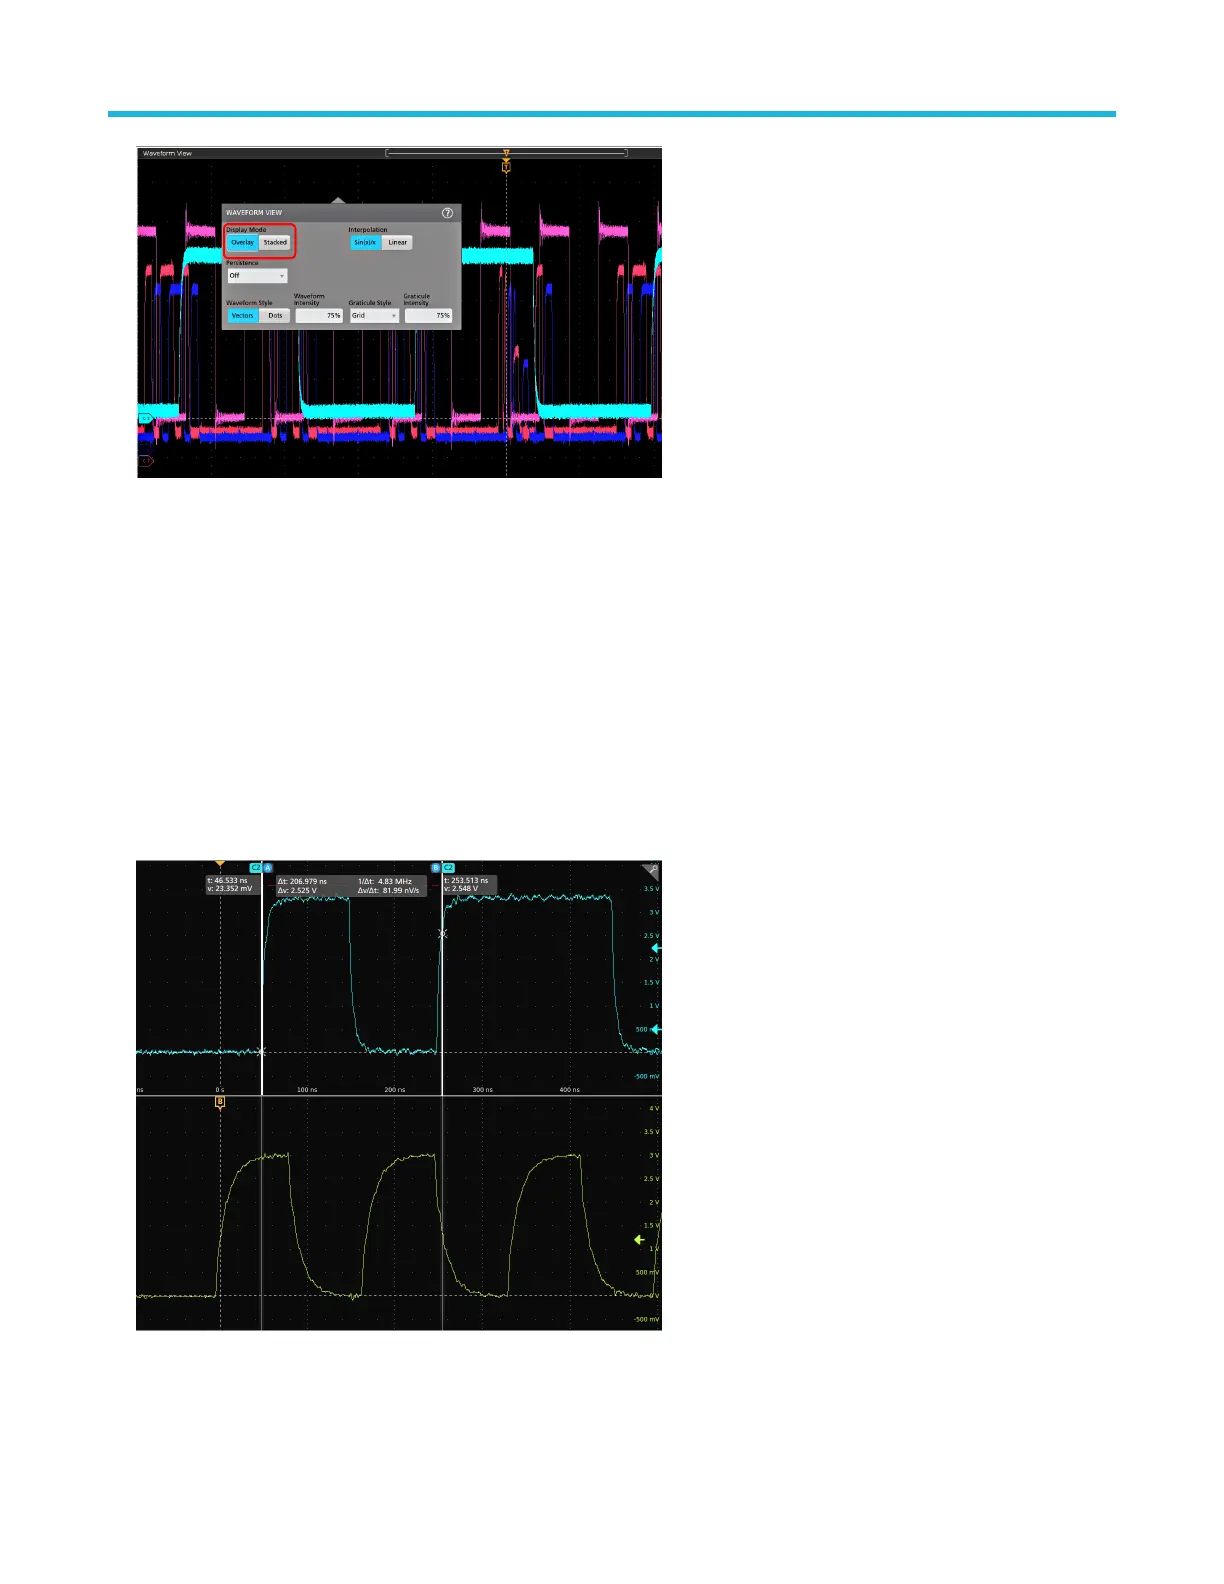
Display and configure cursors
Cursors are on-screen lines that you can move to take measurements on specific parts of a waveform or plot, or between two different
waveforms. Cursor readouts show both current position values and the difference (delta) between cursors. Polar cursor readouts are
available through the cursor configuration menu for XY and XYZ plots.
1. Tap the waveform slice (in Stacked mode), or the channel or waveform badge (in Overlay mode) to which you want to add cursors.
2. Tap the Add New...Cursors button, or push the front-panel button. The cursors are added to the display.
3. Use Multipurpose Knobs A and B to move the cursors, or touch and drag a cursor. Cursors show readouts that show position and
difference measurements between the cursors.
4. To move the cursors to a different channel or waveform, just tap in that waveform graticule.
Operating basics
58
 Loading...


