Data reduction is computed using the standard deviations which
group the data into “dry” and “wet” categories. The limits of the
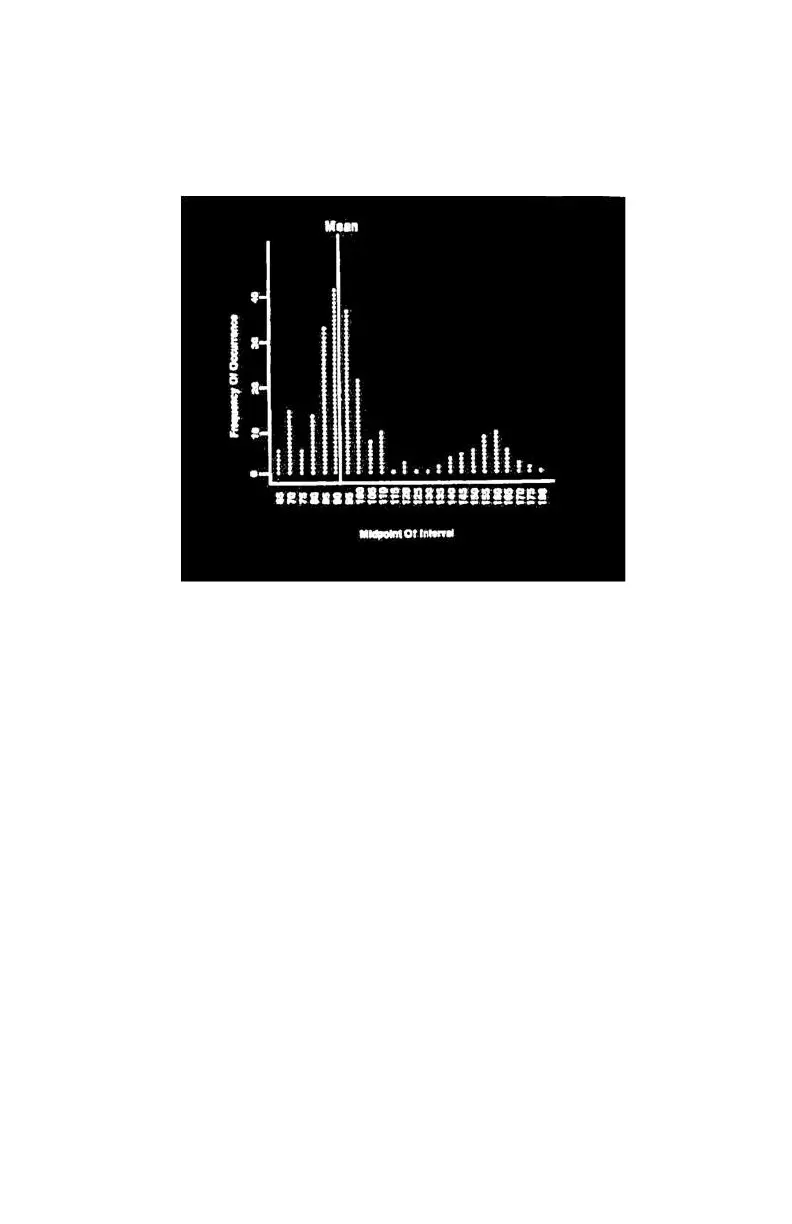
“dry” area are shown below.
Figure 8. Midpoint of Interval
After limits of the “dry” areas are statistically established, count
rates beyond the three standard deviation boundary could be
considered to indicate the presence of moisture or other
hydrogen-bearing materials. This area can then be “cut” into
three or four levels for further interpretation.
You may wish to consider taking core samples based on
histogram analysis as a means of determining absolute moisture
content.
 Loading...