6 U1241A/U1242A User’s and Service Guide
1Getting Started
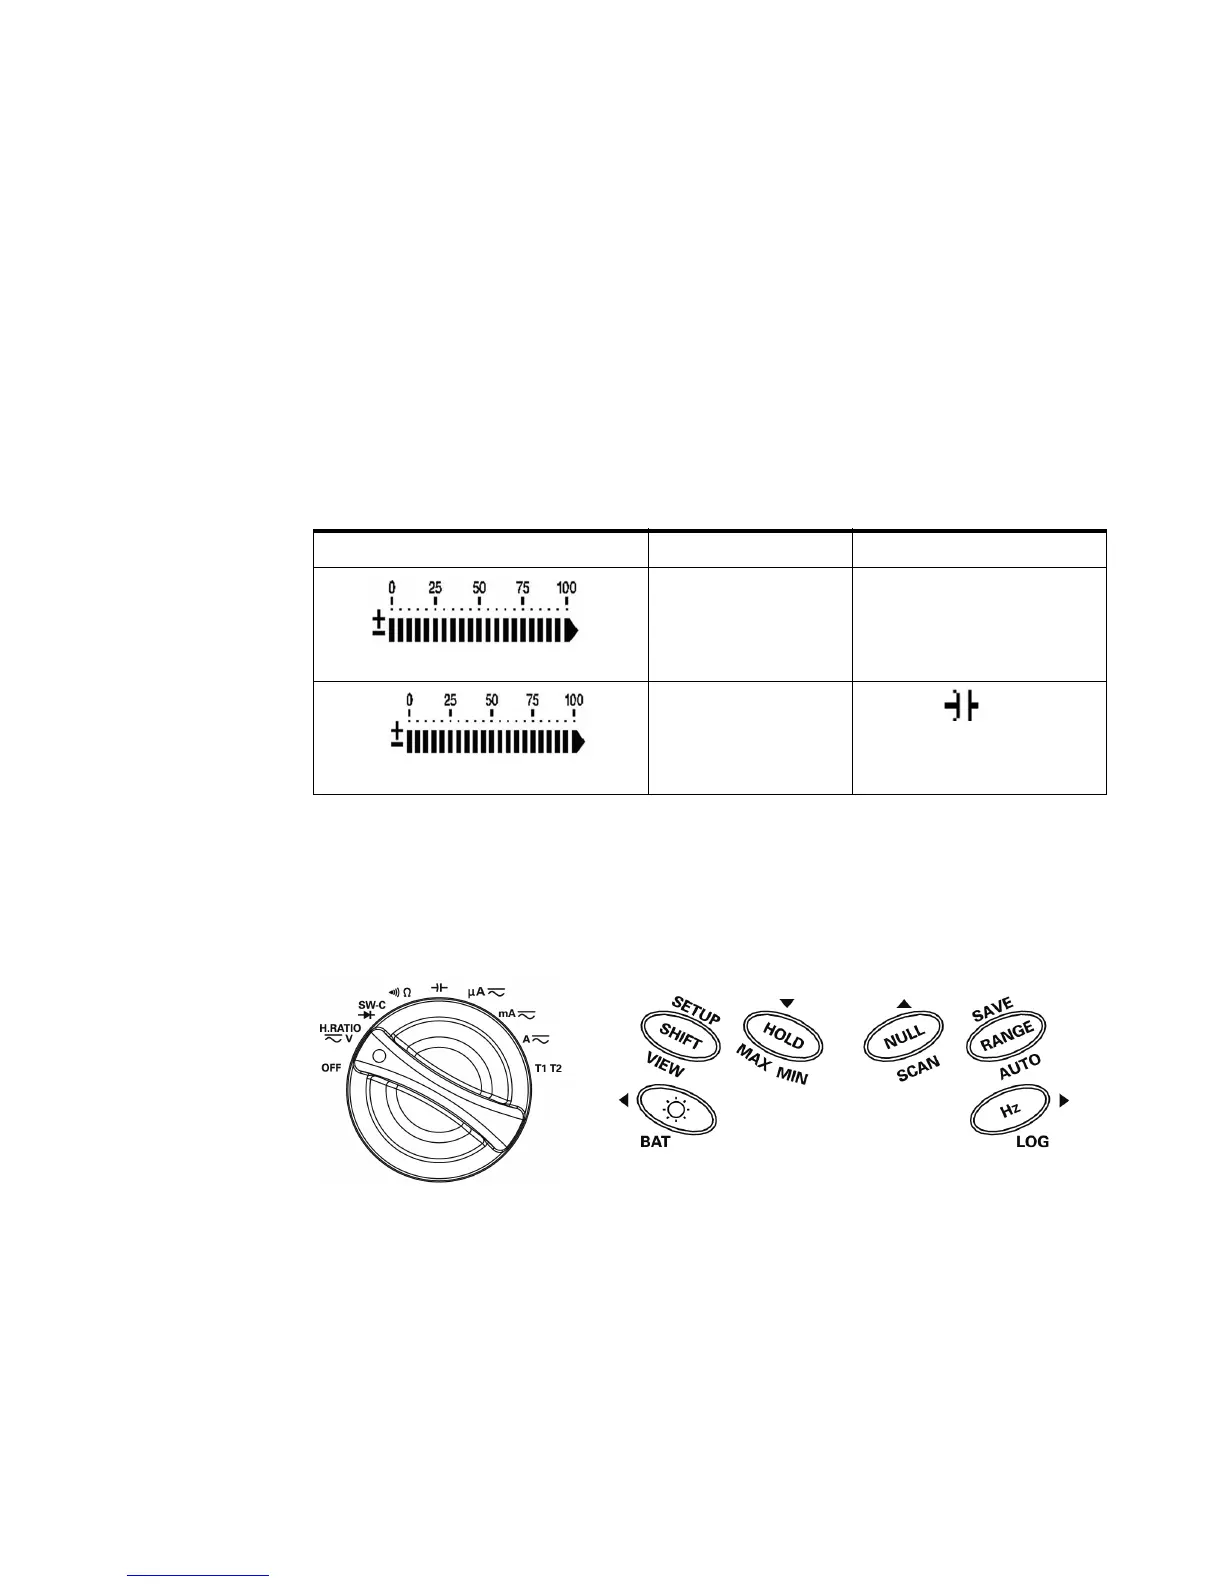
Analog Bar Graph
When frequency is indicated on the primary display during voltage or cur-
rent measurement, the bar graph represents the voltage or current value.
When 4–20 mA% scale or 0–20 mA% scale is indicated on the primary dis-
play, the bar graph represents the current value. Each segment represents
500 or 50 counts depending on the range indicated on the peak bar graph.
Table 1 - 3 Bar graph counts
The Keypad and Rotary Switch at a Glance
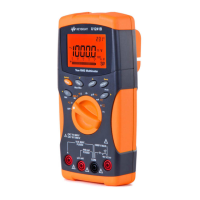
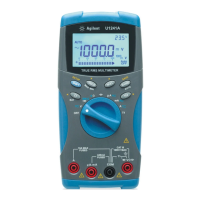
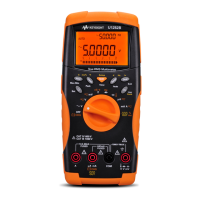
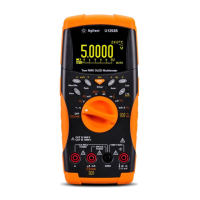
Figure 1-4 Keypad and rotary switch of a U1242A handheld digital multimeter
Range Counts / Segment Function
50 Diode
500
V, A, Ω,
 Loading...