S1 TITAN, T
RACER
5, and CTX User Manual
030.0
112.04.0
56 of 67
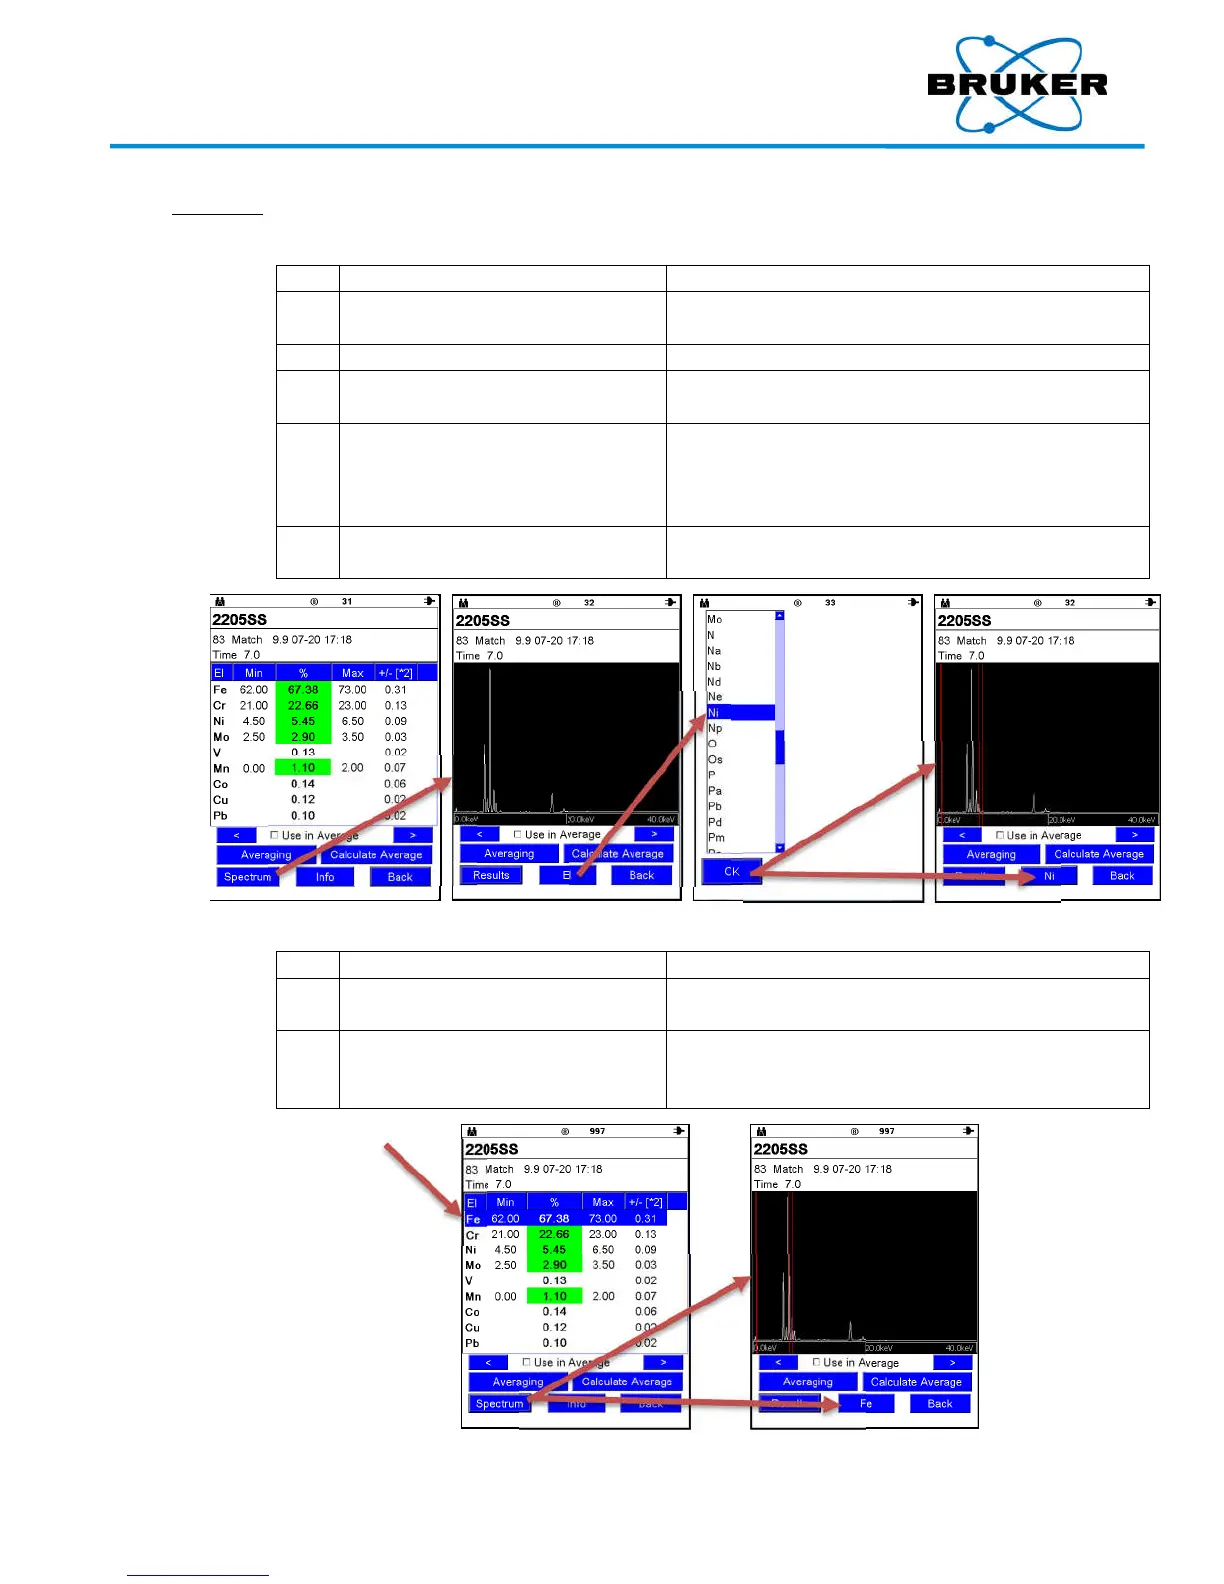
11.1. Spect
rum
spectrum
To view
the spectrum
an
d specific elements
for the
selected assay
–
From
the
Resul
ts
scr
een
of a
spec
ified assay, tap Spectrum.
The Spec
trum
scre
en is displayed.
A list of element symbols is displayed.
Scro
ll down to see all elements.
Tap o
ne.
The elem
ent is highlighted.
The spec
trum is displayed with one or more red
vertical b
ars identifying peaks for the selected
element. El is now replaced with the symbol of the
selected element.
To iden
tify
a spec
trum peak
, tap
it.
One or m
ore red vertical bars is displayed and the
element
symbol is displayed on the El button.
To view the spectrum and specific elements for the selected assay an alternative way –
From
the
Resul
ts
scr
een of a
spec
ified assay, tap an element.
The elem
ent row is highlighted.
The spectrum is displayed with that element’s peaks
not
ed by red vertical bars. The selected element’s
symbol is displayed on the El button.
Your Complete Source for
Testing Equipment
www.BergEng.com
Berg Engineering & Sales Company, Inc.
1-847-577-3980
Info@BergEng.com

 Loading...

