fx-991EX Quick Start Guide 27
Press p one more time to calculate the probability
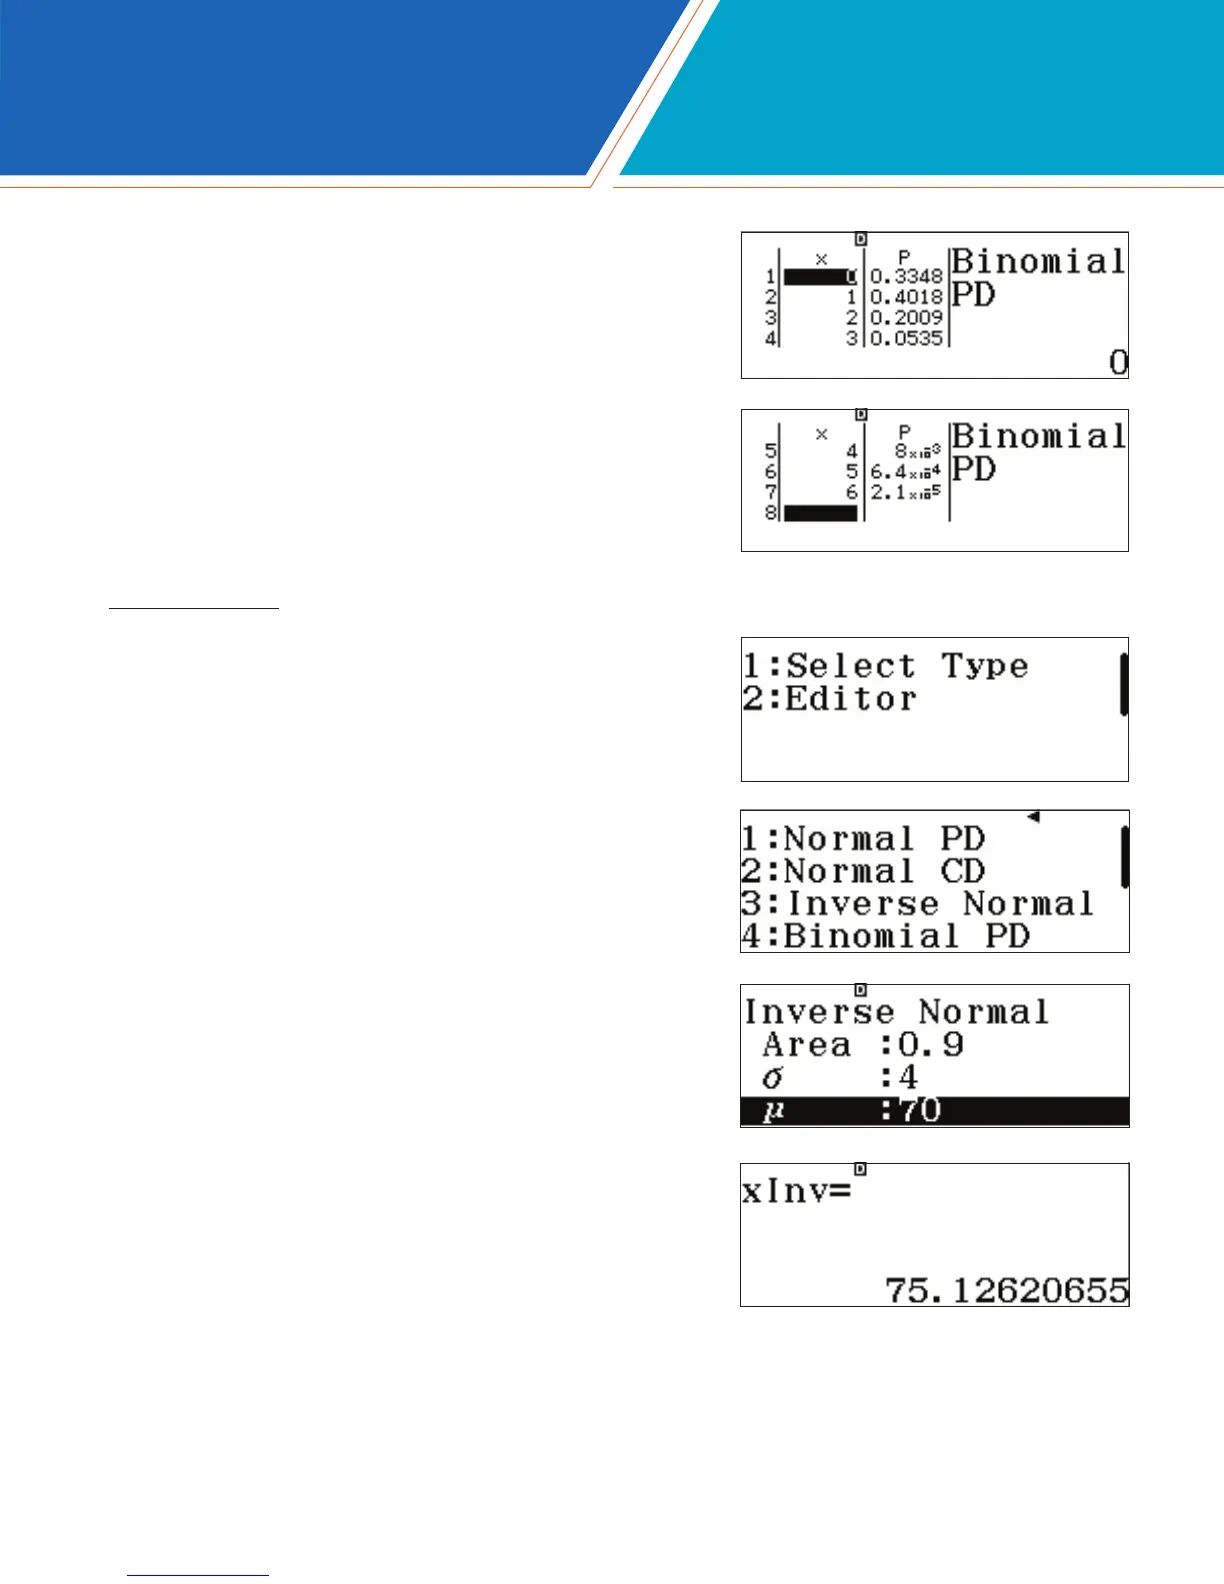
distribution table.
Notice how the small probabilities are expressed in proper
scientic notation!
INVERSE NORMAL
To calculate an Inverse Normal Distribution, press
i1(Select Type).
(“Editor” edits the previous PD’s data list.)
Select 3(Inverse Normal).
Input the values as shown to answer the question: “If the heights
of U.S. males are normally distributed with a mean of 70 inches
and a standard deviation of 4 inches, what range denes the
tallest 10% of U.S. males?”
Press p once more to reveal the result. To be in the top 10%
of U.S. males by height, a man must be over 75 inches (6’3”) tall.
DISTRIBUTION

 Loading...


