Model8555A
General
Information
Table 1-1.
8555A/8552A/8552B
Specifications
(Continued)
Residual Responses: Referred
to
signal level
at
input
mixer
on
fundamental mixi·ng:
<-90
dBm.
Display Range
Log:
70 dB, 10 dB/div with 8552B 2 dB/div log
expand on a 16 dB.display.
Linear: From
0.1 mV
to
100 mV/div in a 1, 2
sequence on an 8-division display.
Display Uncalibrated Light: Panel light warns
operator
of
uncalibrated
amplitude
display if the
IF
or
video bandwidth selected is
too
narrow for
combination of scan width
and
scan time
se-
lected.
Input Attenuator Range:
0-
50 dB in
10
dB steps.
ABSOLUTE CALIBRATION ACCURACY
'I'he overall absolute calibration accuracy
of
the
spectrum analyzer
in
a particular application
is
a
function of the measurement technique.
The follow-
ing
elements also affect absolute calibration accuracy:
Frequency Response: With
10 dB
input
attenuator
setting.
Frequency
Mixing
IF
Freq.
Frequency
Range
Mode Response
(GHz)
(n)
(MHz)
(dB
max.)
0.01-
2.05
1-
2050 ±1.0
1.50 - 3.55
1-
550
±1.0
2.07-
6.15
2-
2050 ±1.25
2.60-
4.65
1+
550 ±1.0
4.11-
6.15
1+
2050 ±1.0
4.13-
10.25
3-
2050 ±1.5
6.17.
10.25
2+
2050
±1.5
6.19-
14.35
4-
2050
±2.0
8.23-
14.35
3+
2050
±2.0
10.29 - 18.00
4+
2050
±2.0
IF
gain variation with different bandwidth settings:
(at
20°C).
Log: ±0.5 dB.
Linear:
± 5.8%.
Amplitude Display: Log
±0.25 dB/dB
but
not
more
than ±1.5
dB
over the full 70 dB display range.
Linear: ±2.8% of full 8-division deflection.
Input
RF
Attenuator: Frequency response typically
±0.6 dB from
10
MHz
to 18 GHz.
Log
Reference Level: Accurate to ±0.2
dB
(±2.3%
Linear Sensitivity).
Log
Reference
Level
Vernier: Accurate to ±0.1 dB
(1.2%) in
0, -6, and
-12
dB positions; otherwise,
±0.25 dB (±2.8%).
Calibrator Output: Amplitude
·30
dBm, ±0.3 dB.
Frequency
30
MHz,
±0.3 MHz (8552A),±3 kHz
(85528).
INPUT SPECIFICATIONS
Input Impedance: 50!2 nominal
(0.01-
18 GHz).
Reflection
Coefficiertt:<0.130 (1.30 SWR) for input
RF
attenuator
settings
~10
dB.
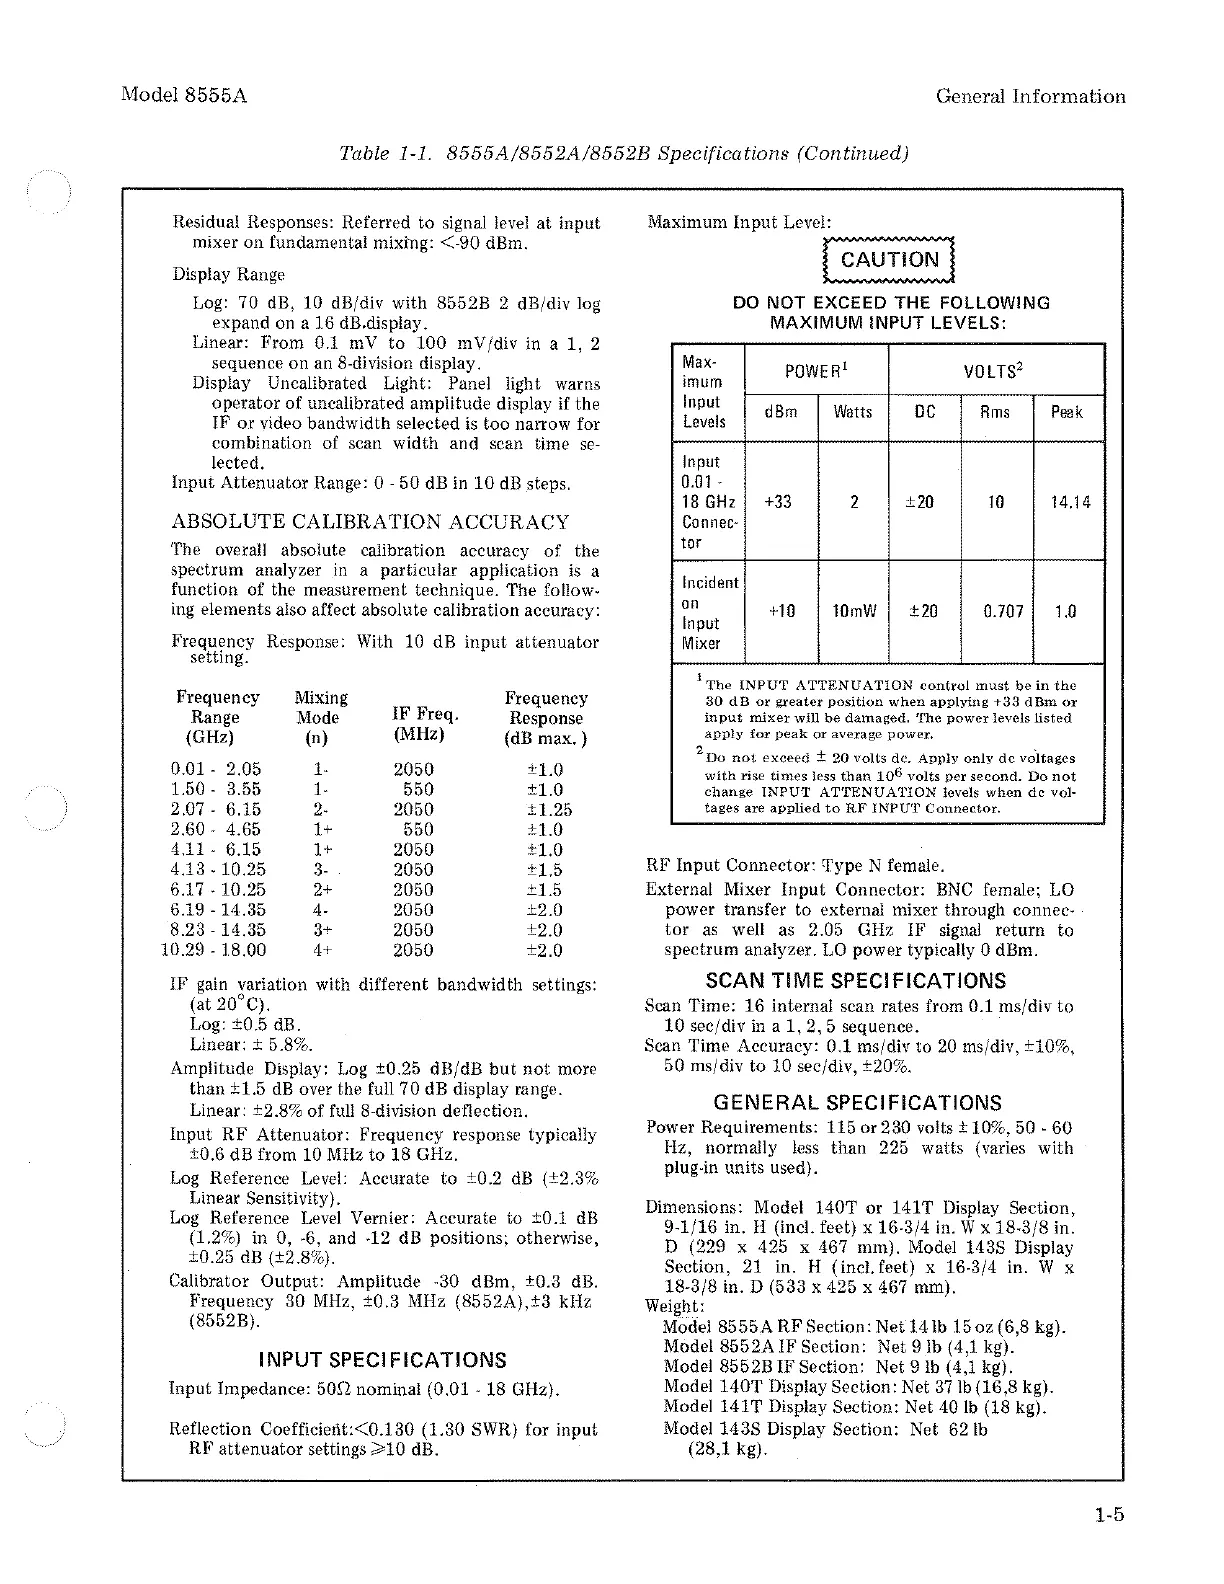
Maximum
Input
Level:
(-~~:0~~
DO
NOT EXCEED THE FOLLOWING
MAXIMUM
INPUT LEVELS:
Max-
imum
Input
Levels
dBm
Watts
DC
Rms
Peak
Input
0.01
-
18
GHz
+33
2
±20
10
14.14
Con
nee-
tor
Incident
1.0
on
+10
Input
10mW
±20
0.707
Mixer
1
The
INPUT
ATTENUATION
control
must
be
in
the
30
dB
or
greater
position
when
applying
+33
dBm
or
input
mixer
will
be
damaged.
The
power
levels
listed
apply
for
peak
or
average
power,
2
Do
not
exceed
±
20
volts
de.
Apply
only
de
voltages
with
rise
times
less
than
106
volts
per
second.
Do
not
change
INPUT
ATTENUATION
levels
when
devol-
tages
are
applied
to
RF'
INPUT
Connector.
RF Input Connector: Type N female.
External Mixer
Input
Connector:
BNC
female;
LO
power transfer to external mixer through connec-
tor
as
well
as
2.05 GHz
IF
signal return to
spectrum analyzer.
LO
power typically 0 dBm.
SCAN TIME SPECIFICATIONS
Scan Time: 16 internal scan rates from 0.1 ms/div to
10
sec/div
in
a
1,
2, 5 sequence.
Scan Time Accuracy: 0.1 ms/div to
20
ms/div, ±10%,
50
ms/div
to
10 sec/div, ±20%.
GENERAL
SPECIFICATIONS
Power Requirements: 115 or 230 volts± 10%, 50 ·
60
Hz, normally less than 225 watts (varies with
plug-in units used).
Dimensions: Model
140T
or 141 T Display Section,
9-1/16 in. H (incl. feet) x 16-3/4 in. W x 18-3/8 in.
D (229 x 425 x 467 mm). Model 1438 Display
Section, 21 in. H (incl.feet) x 16-3/4 in. W x
18-3/8 in. D (533 x 425 x 467 mm).
Weight:
Model
8555A
RF
Section:
Net
14lb
15 oz (6,8 kg).
Model
8552A
IF
Section: Net
9lb
(4,1 kg).
Model 8552B
IF
Section: Net
9Ib
(4,1 kg).
Model
140T
Display Section: Net
37lb
(16,8 kg).
Model141T
Display Section: Net 40 lb (18 kg).
Model 143S Display Section: Net
62lb
(28,1 kg).
1-5

 Loading...


