Instruction Manual Easygraph
Page 23
7.5.2 Using Different Types of Display to Evaluate Examination
7.5.2.1 Overview Display
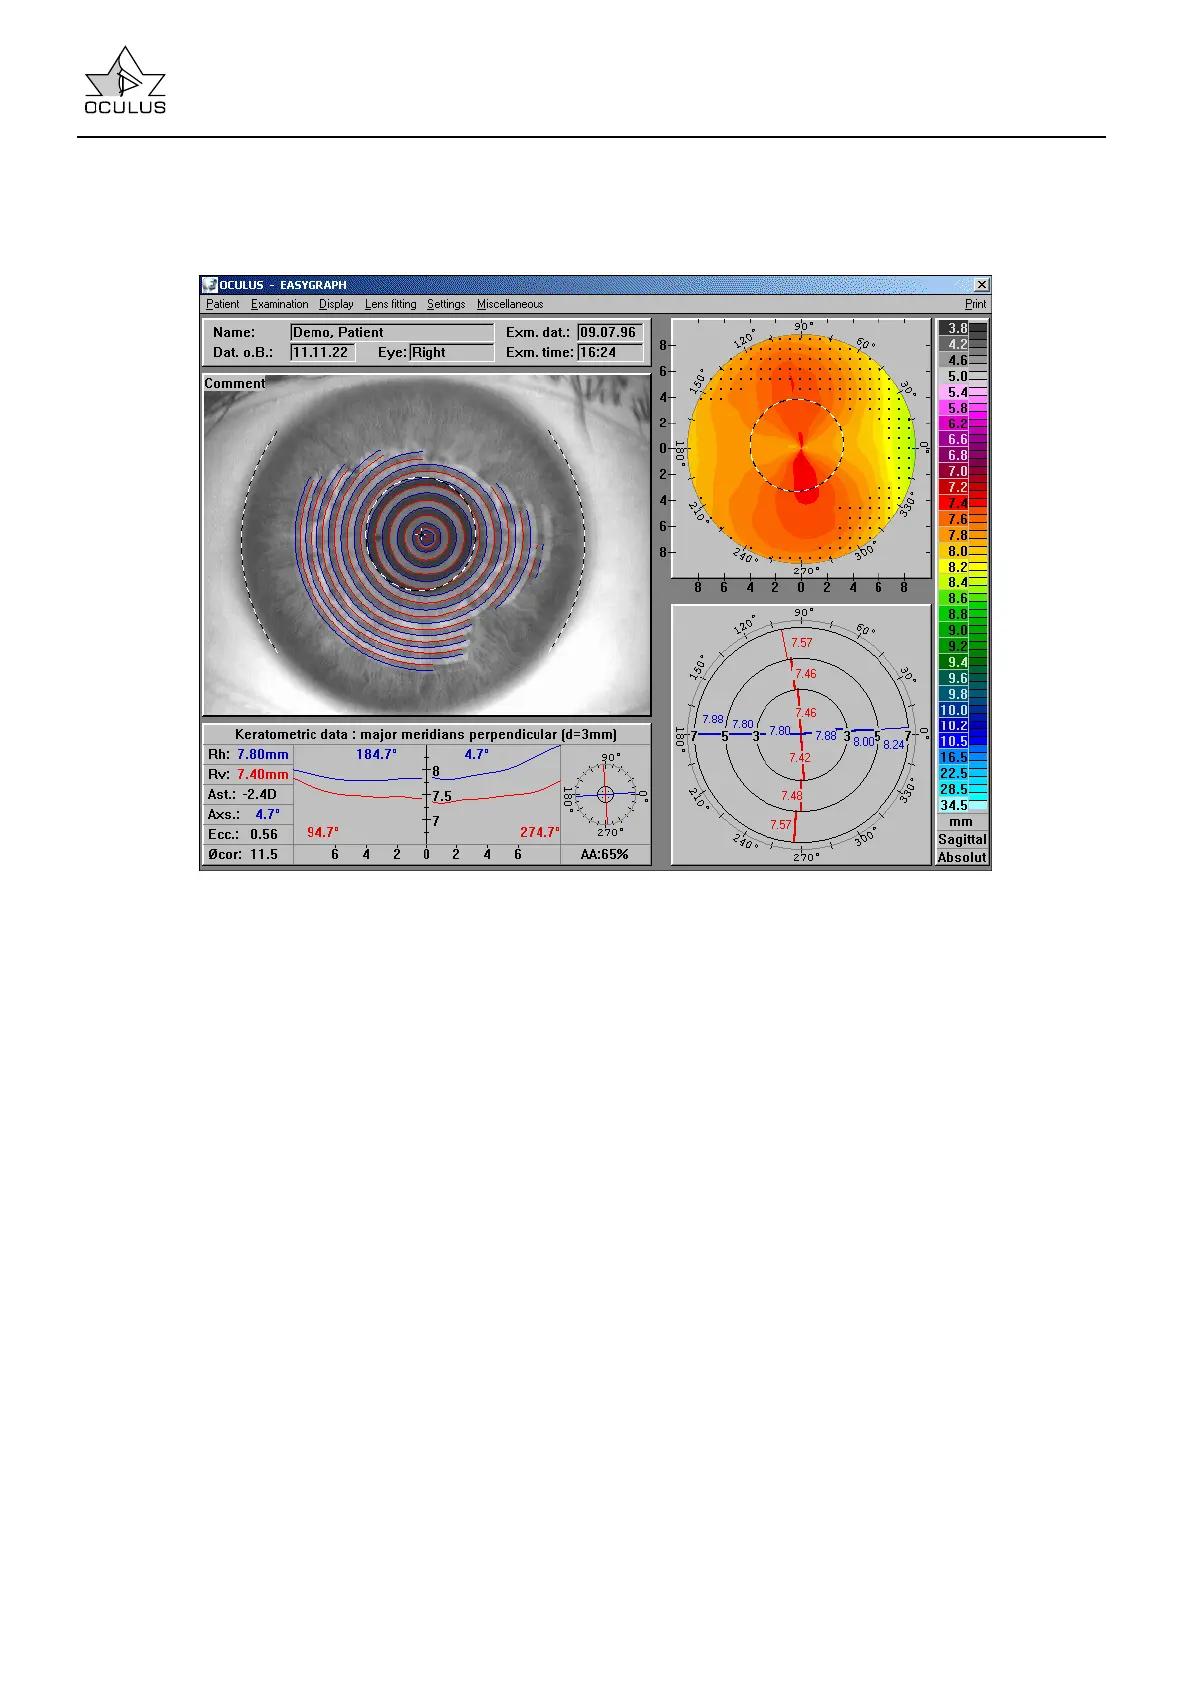
Overview Display combines several different
evaluation displays and thus provides a quick survey
of the corneal topography which has been
measured.
The following display fields are provided:
• Patient Data
(at the upper left).
• Reduced Camera Image
of the measurement (middle left). The ring edges
(red/blue) determined during image processing
and the iris and pupil (black/white) are also
shown in order that the measurement can be
checked. The pupil center is shown as a
black/white cross. The distance between the
center of the topographic corneal map and the
pupil center (fixation difference) is shown as
numerical value in the lens fitting software (cf.
7.5.2.10 page 45).
• Colored Topographic Image
(at the upper right). Different colors are allocated
to the local radii of curvature which have been
measured; these are displayed in position-
dependent form. This form of display gives the
most accurate impression of the curvature profile
of the measured cornea.
Here, too, the pupil edge is presented as a black
and white line.
• Color Bar
At the right margin of the overview display is a list
of the radii of curvature to which the colors
correspond. The three fields below the color bar
describe the radii of curvature more precisely:
The first field shows the unit of curvature
(millimeters or diopters) as well as the increment
(e.g. 0.25 D) in the case of the "relative" color bar
(see below).
The next field shows whether the radii are sagittal
or tangential. The last field shows the type of
color scale, i.e. "absolute" or "relative" (cf. 7.5.4
page 60).
• Keratometer Data (at the lower left)
Both major meridians are ascertained on the 3
mm ring of the cornea; by definition, these always
lie at an angle of 90° to each other.
The position of the major meridians is seen in the
small diagram in the right part of the field. The
curvature profile on these major meridians from
the center to the perimeter of the field appears in
the middle of the diagram.
In addition, the usual keratometer values appear
in the screen at the left side of the diagram,
Rh: Horizontal radius of curvature in the center
of the cornea.
Rv: Vertical radius of curvature in the center of
the cornea.