12
R7 English
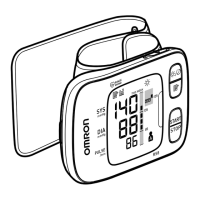
Night Data Graph
Night
Data Mark
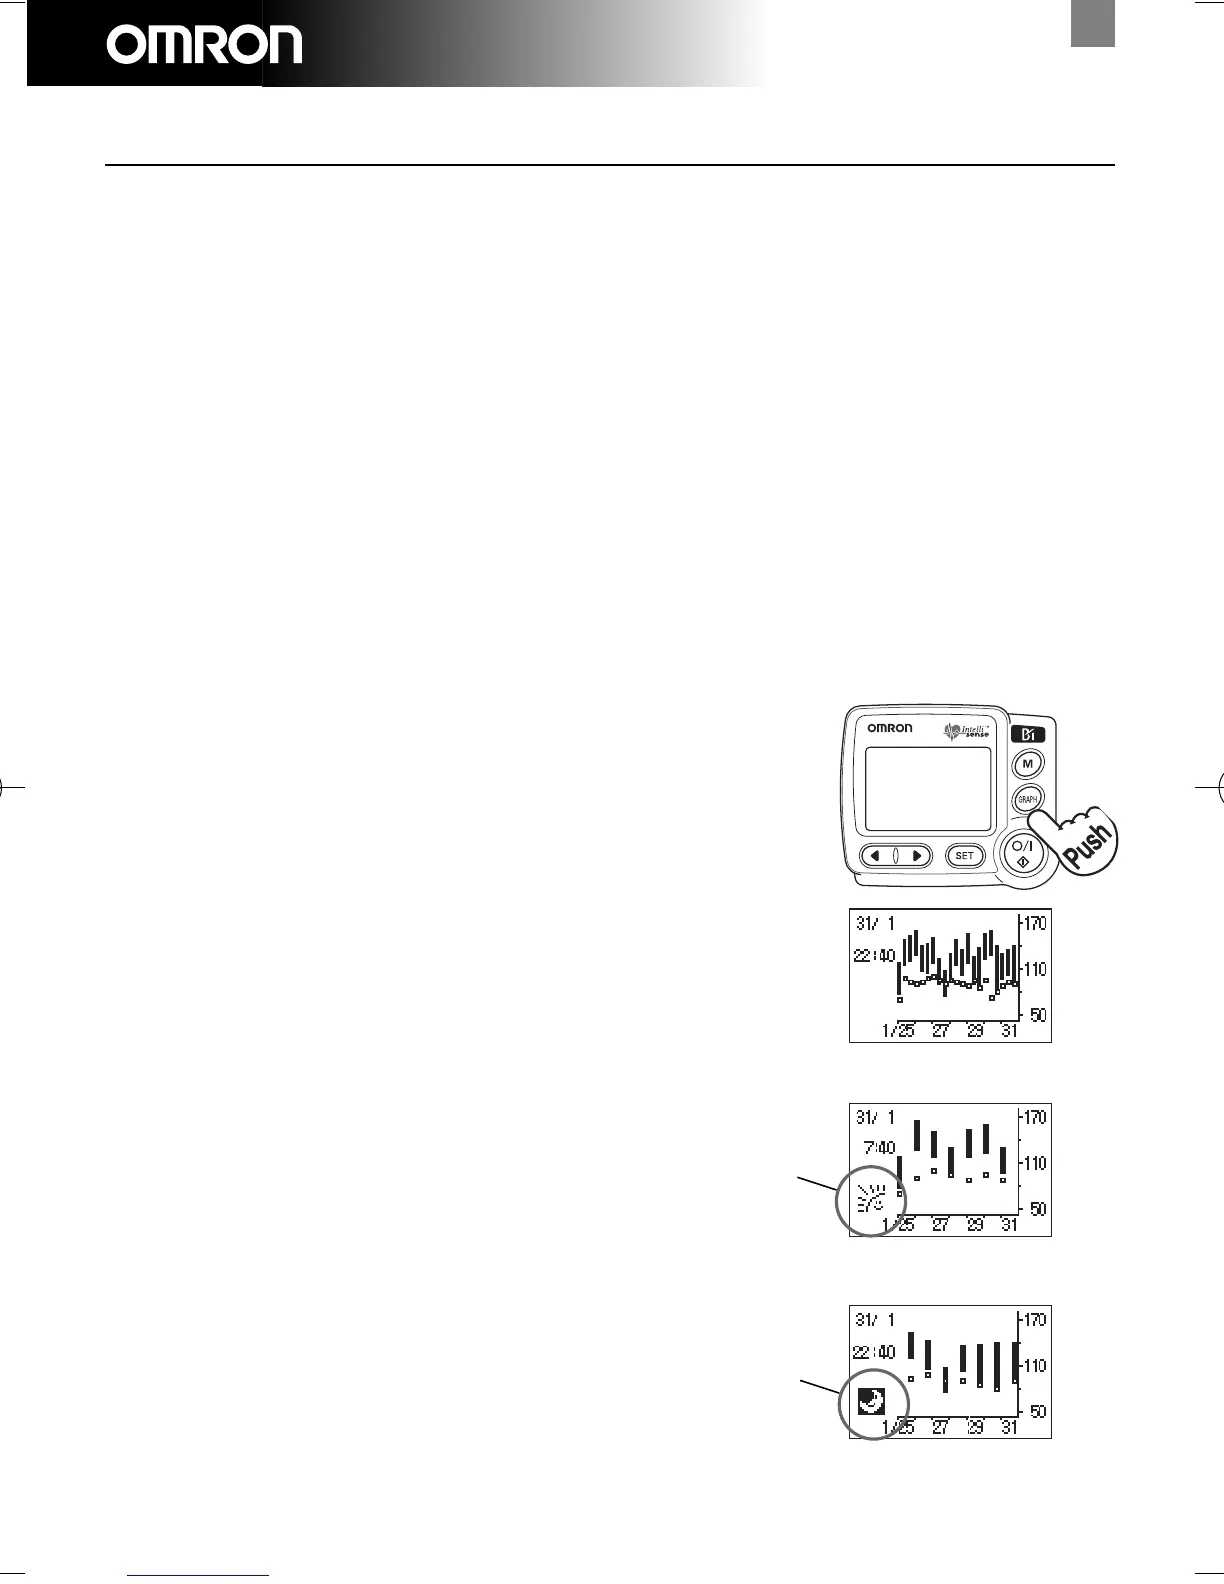
How to use the Graph function
This monitor has the possibility to display the stored measurements as a graph. In order to get
a clear history of your blood pressure the measurements are put in time zones:
• Morning: Measurements made between 0:00 and 9:59
• Daytime: Measurements made between 10:00 and 17:59
• Evening: Measurements made between 18:00 and 23:59
The last measurement in each time zone will be displayed. For example if you measure 3 times
in the same time zone on the same day only the third reading will be displayed. On the other
hand all readings will be stored in the memory (See also page 11).
There are three different graphs available:
• All data graph: displays all measurements per week
• Morning data graph: displays all morning measurements per week
• Evening data graph: displays all evening measurements per week
No graph display is provided for daytime data only.
To display the graph push the GRAPH CALL button.
All Data Graph is displayed.
Push the GRAPH CALL button again to display the
Morning Data Graph.
Push the GRAPH CALL button again to display the
Evening Data Graph.
Each time you push the GRAPH CALL button, All,
Morning, and Evening data are displayed in that order
repeatedly.
All Data Graph
Morning Data graph
Morning
Data Mark
HEM-637-E2 EN 7/8/10 9:18 AM Page 12

 Loading...