RPBS-1 PORTABLE SCALE 2.0 18
Concepts
The following concepts are included in this section:
Standard Deviation
Coefficient of Variation
Uniformity (Homogeneity or Evenness)
Standard Deviation
The standard deviation is kind of "mean of the mean," and often can assist
you in interpreting flock data. A “normal” distribution of data means that
most of the weights in a set of data are close to the "average," while
relatively few examples tend to one extreme or the other.
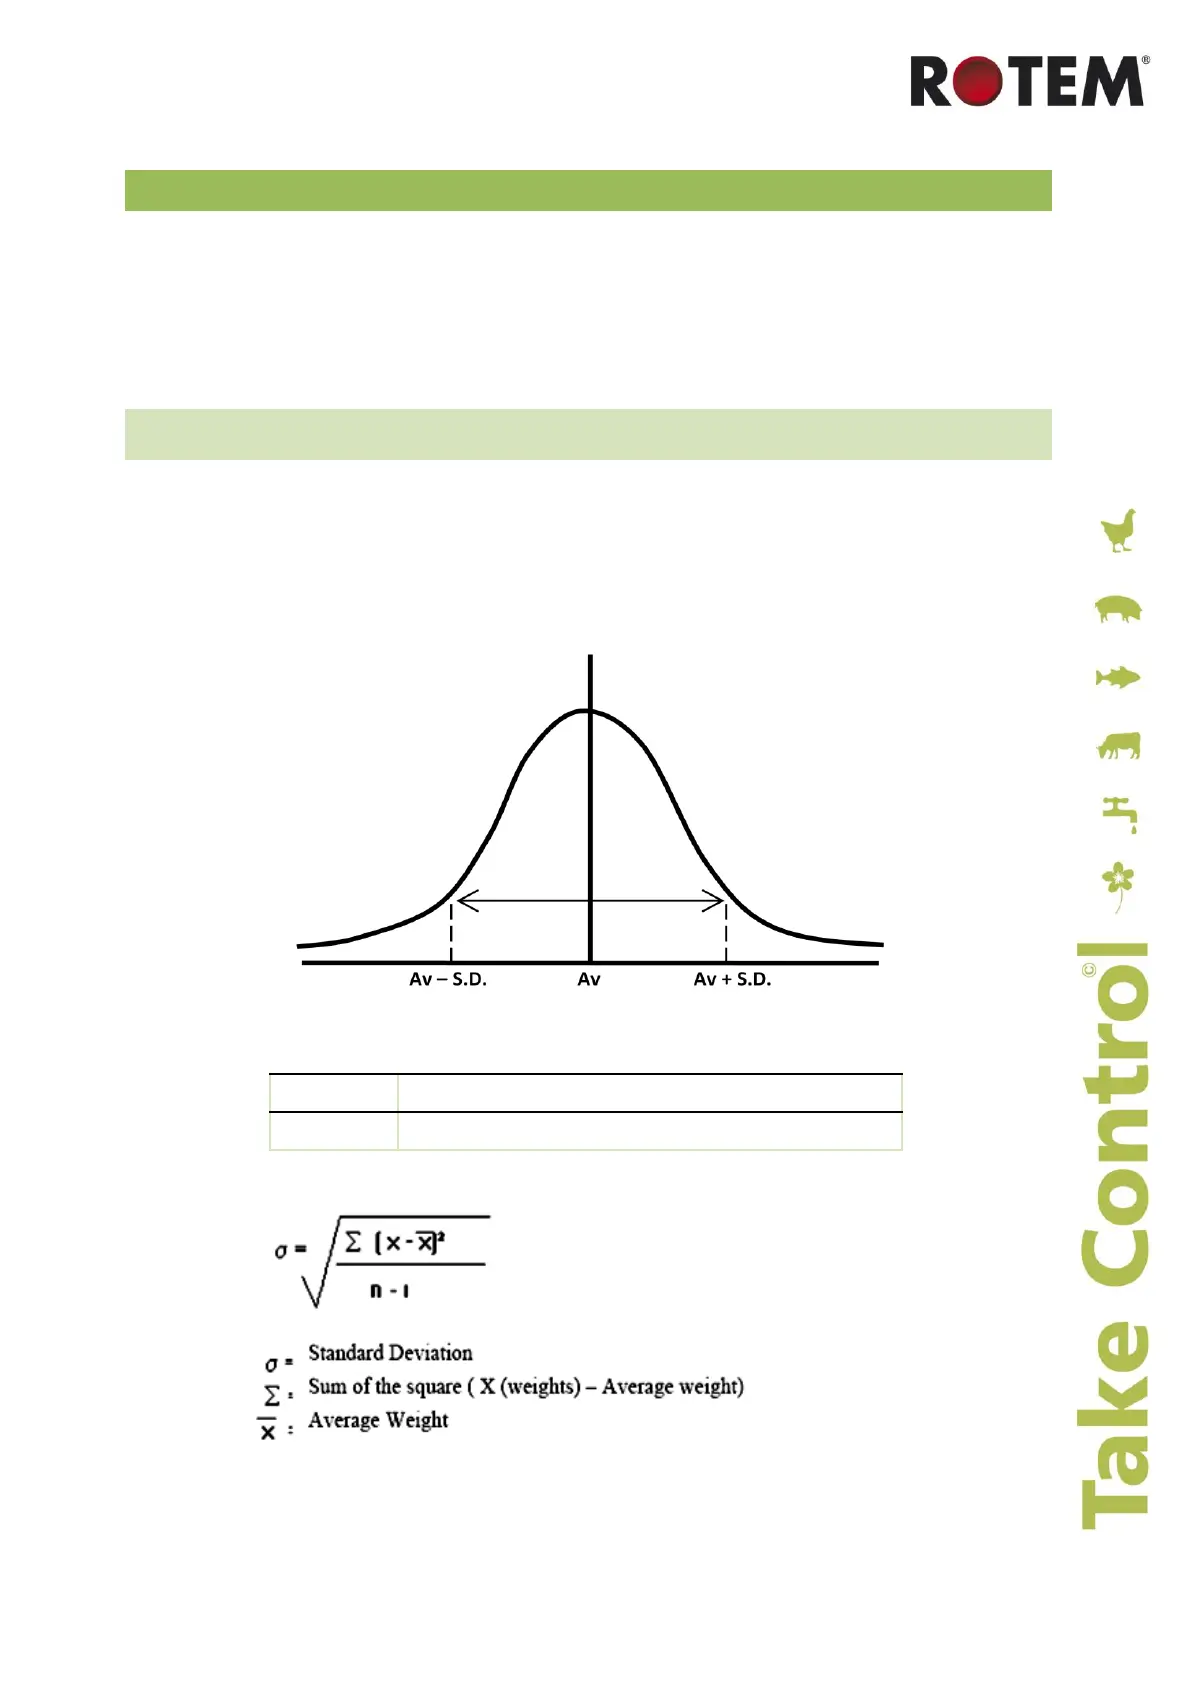
Normal data distributed on a graph appears as in Figure 3.
Figure 3: Normal Standard Deviation Bell Curve
The number of weights for each value on the X-Axis.
Standard Deviation states:
Where n – Number of weights
General rule: The smaller number the value in standard deviation
indicates a more uniform flock.
 Loading...