Analyze Wavefor
mData
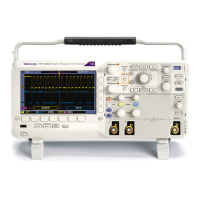
The horizontal
cursor lines on the display
measure the vertical parameters, typically
voltage.
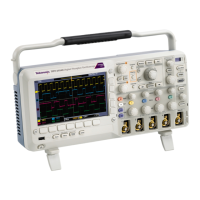
The vertical cursor lines on the display
measure horizontal parameters, typically
time.
The square and ci
rcle shapes in the readout map to the multipurpose knobs when both vertical and horizontal cursors
are present.
Using XY Cursors
When the XY Display mode is on, the cursor readouts will appear to the right of the lower graticule (XY). You can choose
which readouts to display: rectangular, polar, product, or ratio.
NOTE. Push the Measure button for additional cursor menu options, such a s Bring Cursors On Screen and Configure
Cursors.
Using Math Waveforms
Create math waveforms to support the analysis of your channel and reference waveforms. By c ombining and transforming
source wave
forms and other data into math waveforms, you can derive the data view that your application requires.
NOTE. Math waveforms are not available for use with serial buses.
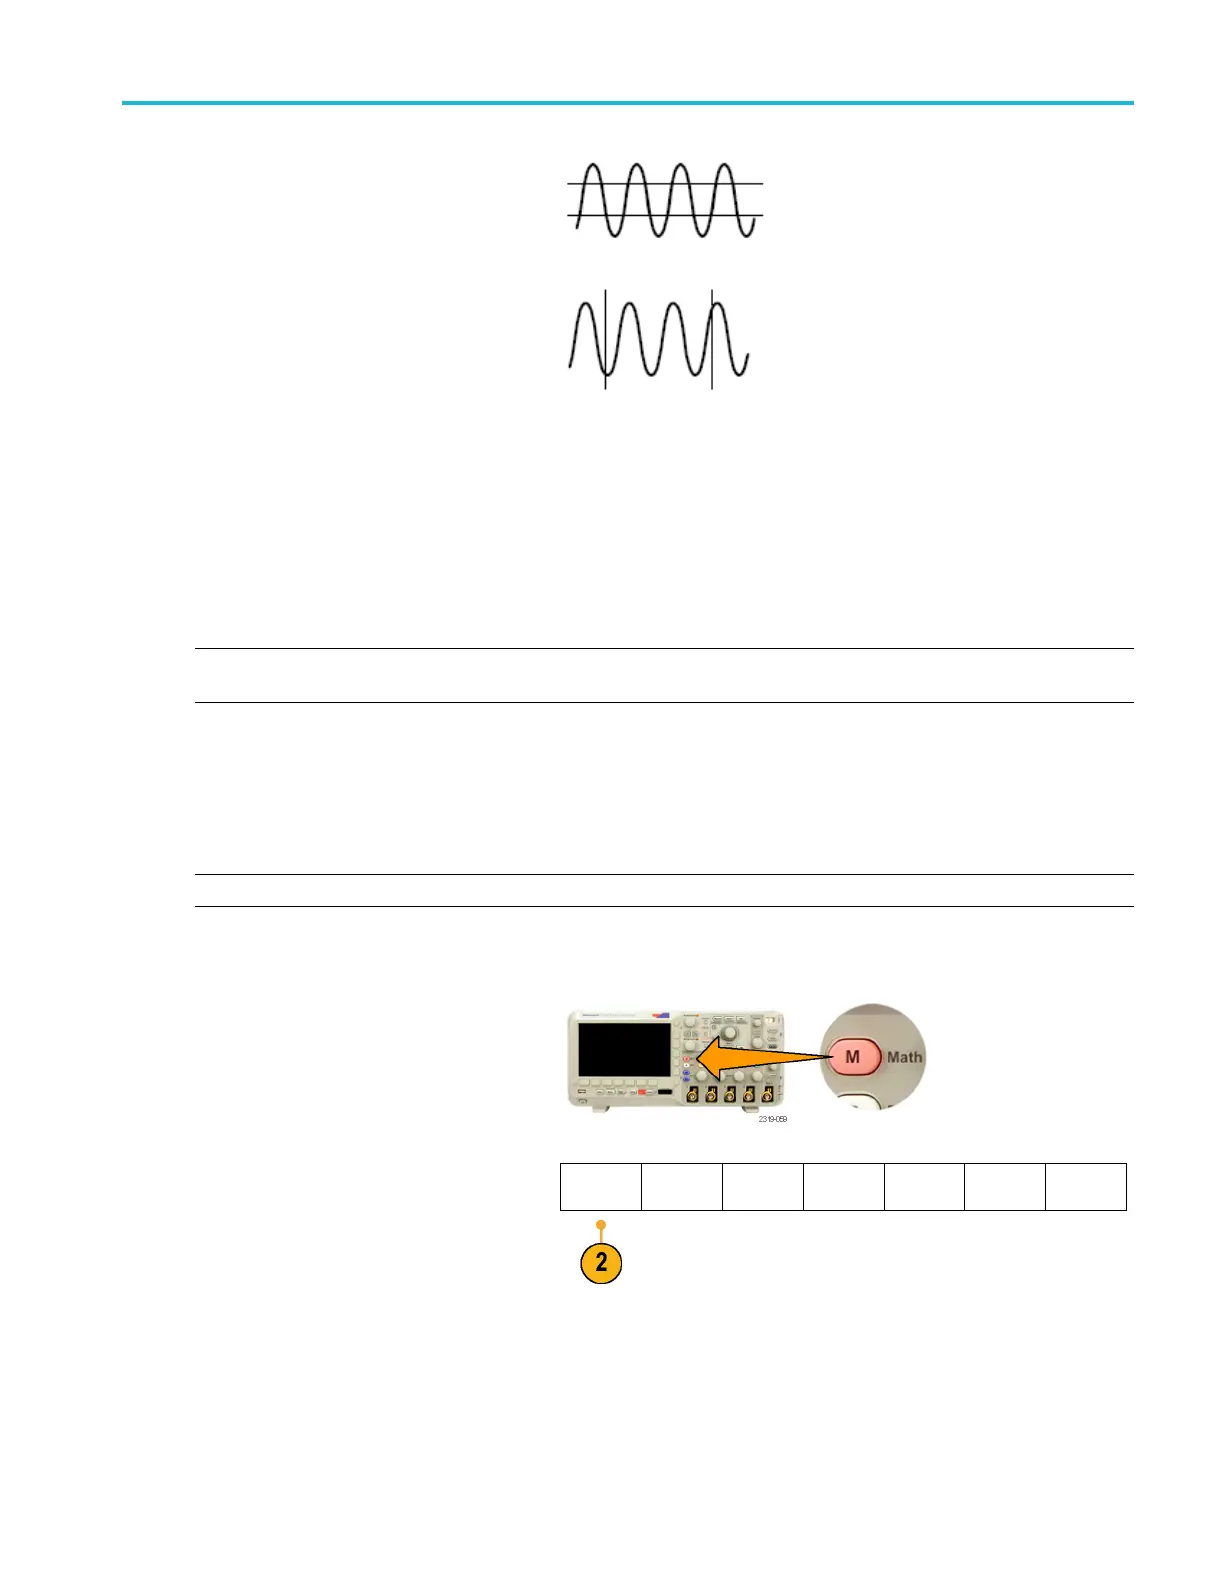
Use the fo
llowing procedure for executing simple (+, –, ×) math operations on two waveforms:
1. Push M for the Math menu.
2. Push Dual Wfm Math.
Dual Wfm
Math
FFT
(M) Label
3. On the side-bezel menu, set the sources to
channel 1, 2, 3, 4, or to reference waveforms
R1 or R2. Choose the +, –,orx operators.
MSO2000B and DPO2000B Series Oscilloscopes User Manual 99
 Loading...