Display a wavefo
rm
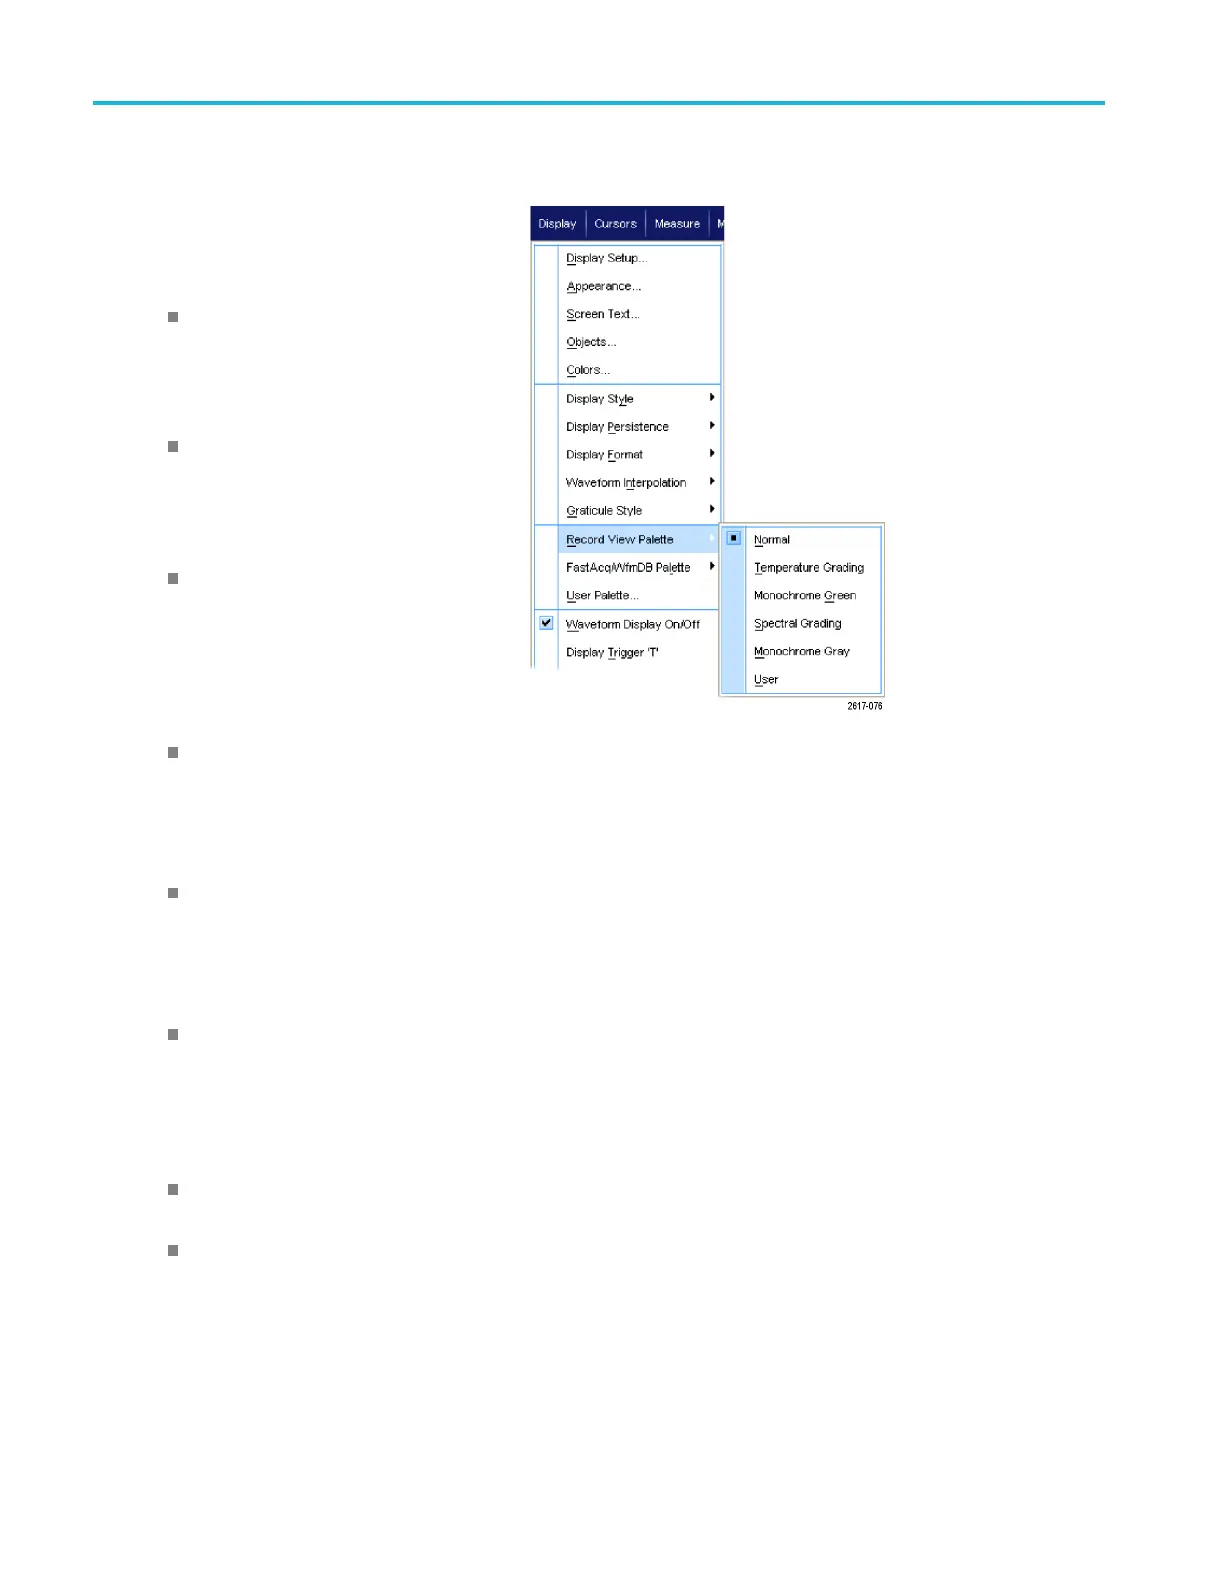
Using the Color Palettes
Select Displa
y > Record View Palette or
FastAcq/WfmDB Palette, and then select
one of the following color schemes for the
waveform and g
raticule:
Normal displ
ays hues and lightness
levels for best overall viewing. The color
of each channel waveform matches the
color of the
corresponding front-panel
vertical knob.
Temperature Grading displays areas of
the waveform with the highest sample
density in
red shades. The areas of
lowest sample density appear in blue
shades.
Monochrome Green displays areas of
the wavef
orm with the highest sample
density in lighter green shades. The
areas of lowest sample density appear
in darker
green shades. It most closely
resembles analog oscilloscope displays.
Spectral G rading displays areas of
the waveform with the highest sample
density in blue shades. The areas of
lowest sample density appear in red
shades.
Monochrome Gray displays areas of
the waveform with the highest sample
density in lighter gray shades. The
areas of lowest sample density appear in
darker gray shades.
User displays the waveform in a
user-defined color.
Quick tips
Cho
ose one of the color grading palettes in the Display > Colors control window to see different sample densities
represented in different colors.
There are two color palettes, one for Record View and one for FastA cq/WfmDB.
98 MSO/DPO70000DX, MSO/DPO70000C, DPO7000C, and MSO/DPO 5000B Series U ser M anual
 Loading...


