Chapter 4: Linear Inequalities Section 1: Using Graphs & Tables
Topics in Algebra 1 © 2001 Texas Instruments Teacher Notes 4-9
Activities (continued)
Worksheet Activity 2
Tell students to:
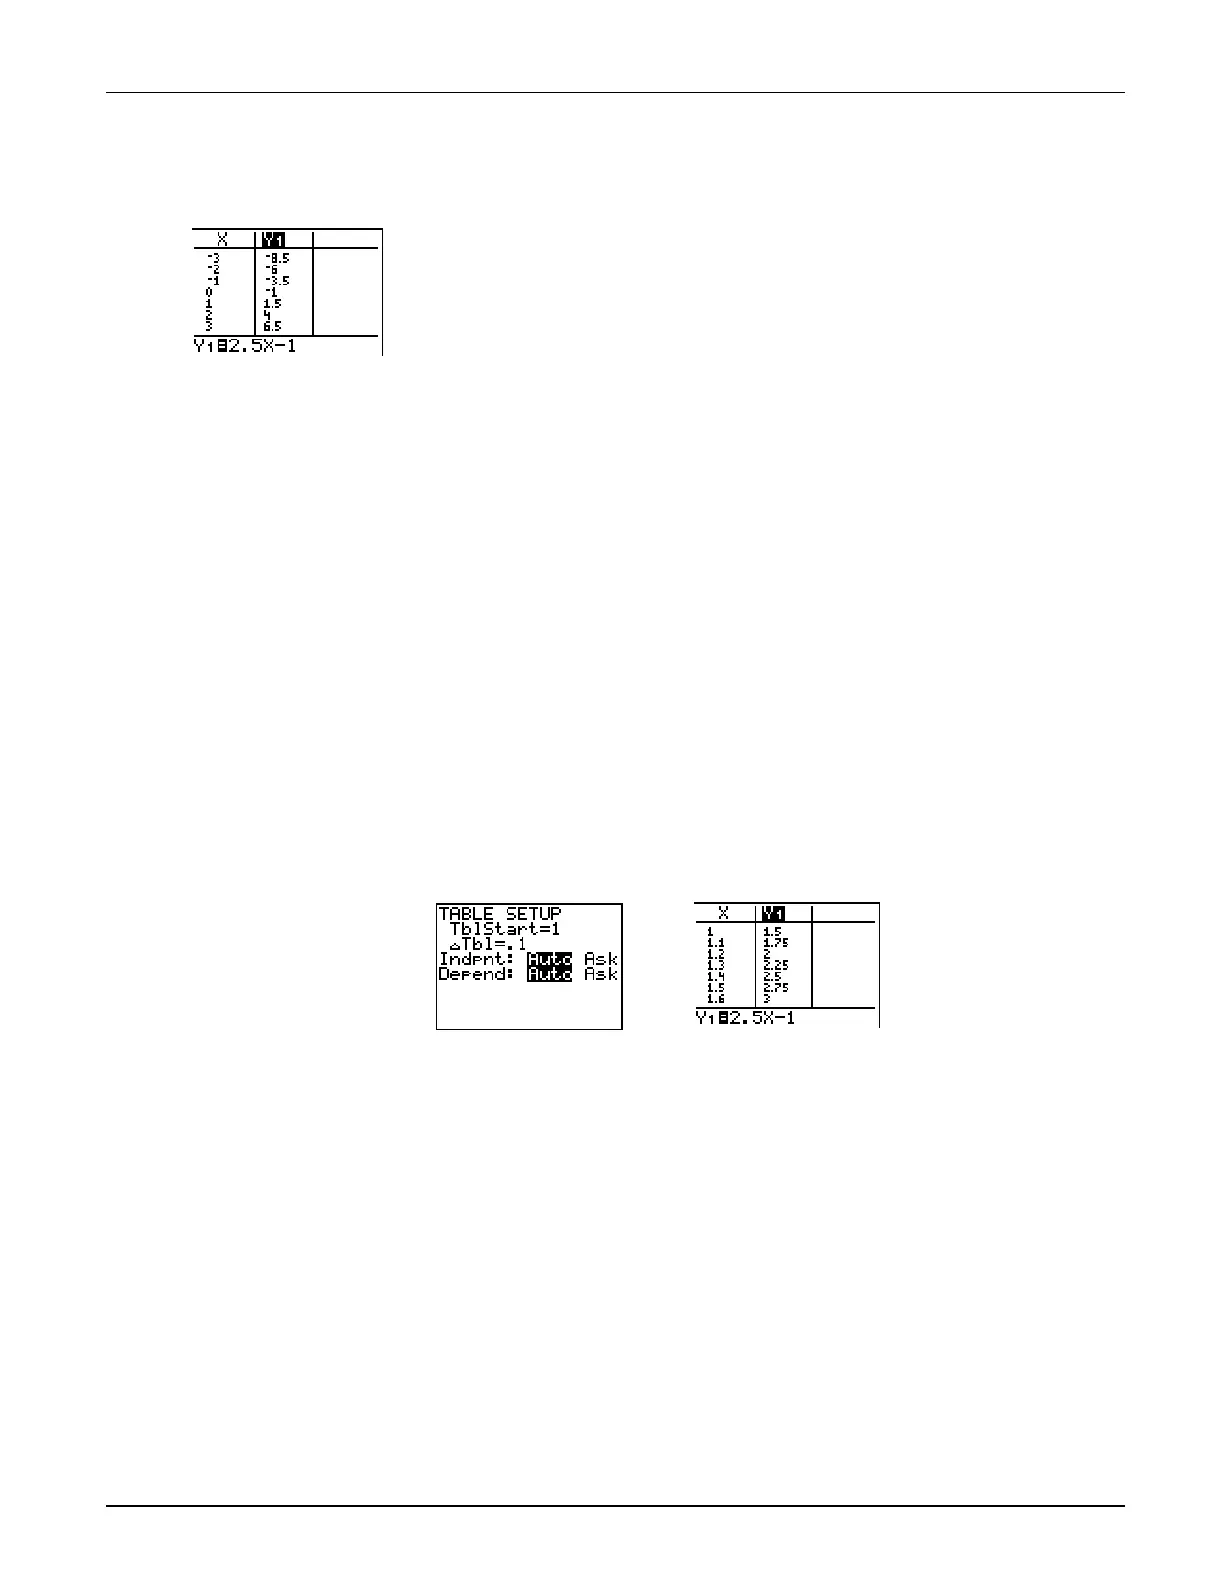
Use the table of the expression
2.5X
−
1
shown on their worksheets
(shown at left) to find out when
2.5X
−
1<3
by first estimating the
answer, and then using number sense to determine the exact
answer. Remind them to write their strategy for the solution and
to draw the solution set on a number line.
From the table, students should see that they need to test more
values between
X=1
and
X=2
to find where
2.5X
N
1<3
.
If you wish the students to continue the activity on their
calculators, tell them to enter the function in the Y= editor. Then
on the
TABLE SETUP
screen
(
-
f
)
, they can refine their
search as shown in the screens below.
The students see that
2.5X
N
1
is equal to
3
at
X=1.6
, but they need
to figure out when
2.5X
N
1< 3
. Students can go to the
TABLE
SETUP
screen and change the settings to
TblStart=1
and
∆
Tbl=.1
,
and then investigate further. This problem should be discussed
to show that the search should still continue because the
endpoint of
1.6
is not in the solution set. The answer is
X<1.6
.
To investigate further
,
refine the table values by changing
TblStart=1.5
, and
∆
Tbl=.01
.

 Loading...


