³
TIp 3: Graphing a Function in the Standard Window
Topics in Algebra 1 © 2001 Texas Instruments
³
TIp 3-1
³
TIp
é
3: Graphing a Function in the Standard Window
You can graph a function on the graph screen. First, enter the function in the Y= editor, and then
you can graph the function in the standard graphing window. Screens on the TI
-
73 may vary.
Calculator Keys Used in This
³
TIp
é
•
&
•
*
•
)
³
TIp
é
Highlights
In the
³
Try-It! example, you will graph a function following these main steps.
1. Enter the function in the Y= editor (
&
).
2. Graph the function on the graph screen (
*
).
Note:
If you reset your calculator defaults (
³
TIp 1:
Resetting Your Calculator
), the graphing window sets up the following
boundaries for the
X
and
Y
values:
L
10
{
X
{
10 and
L
10
{
Y
{
10.
3. Press
)
. Then press
"
or
!
to move the cursor from one plotted point to another.
Tracing the graph displays the (
X,Y
) values at the bottom of the screen.
For some functions, the graphing window has to be adjusted so that you can see your graph. This
³
TIp uses the standard window settings (
L
10
{
X
{
10 and
L
10
{
Y
{
10). The function selected
for the example on the next page displays the graph in this window. For more information on
adjusting window settings on the
WINDOW
menu, see
³
TIp 5:
Adjusting the Viewing Window
.
Note:
The examples in the next section assume that the calculator has been reset to the default settings as described in
³
TIp 1:
Resetting Your Calculator.
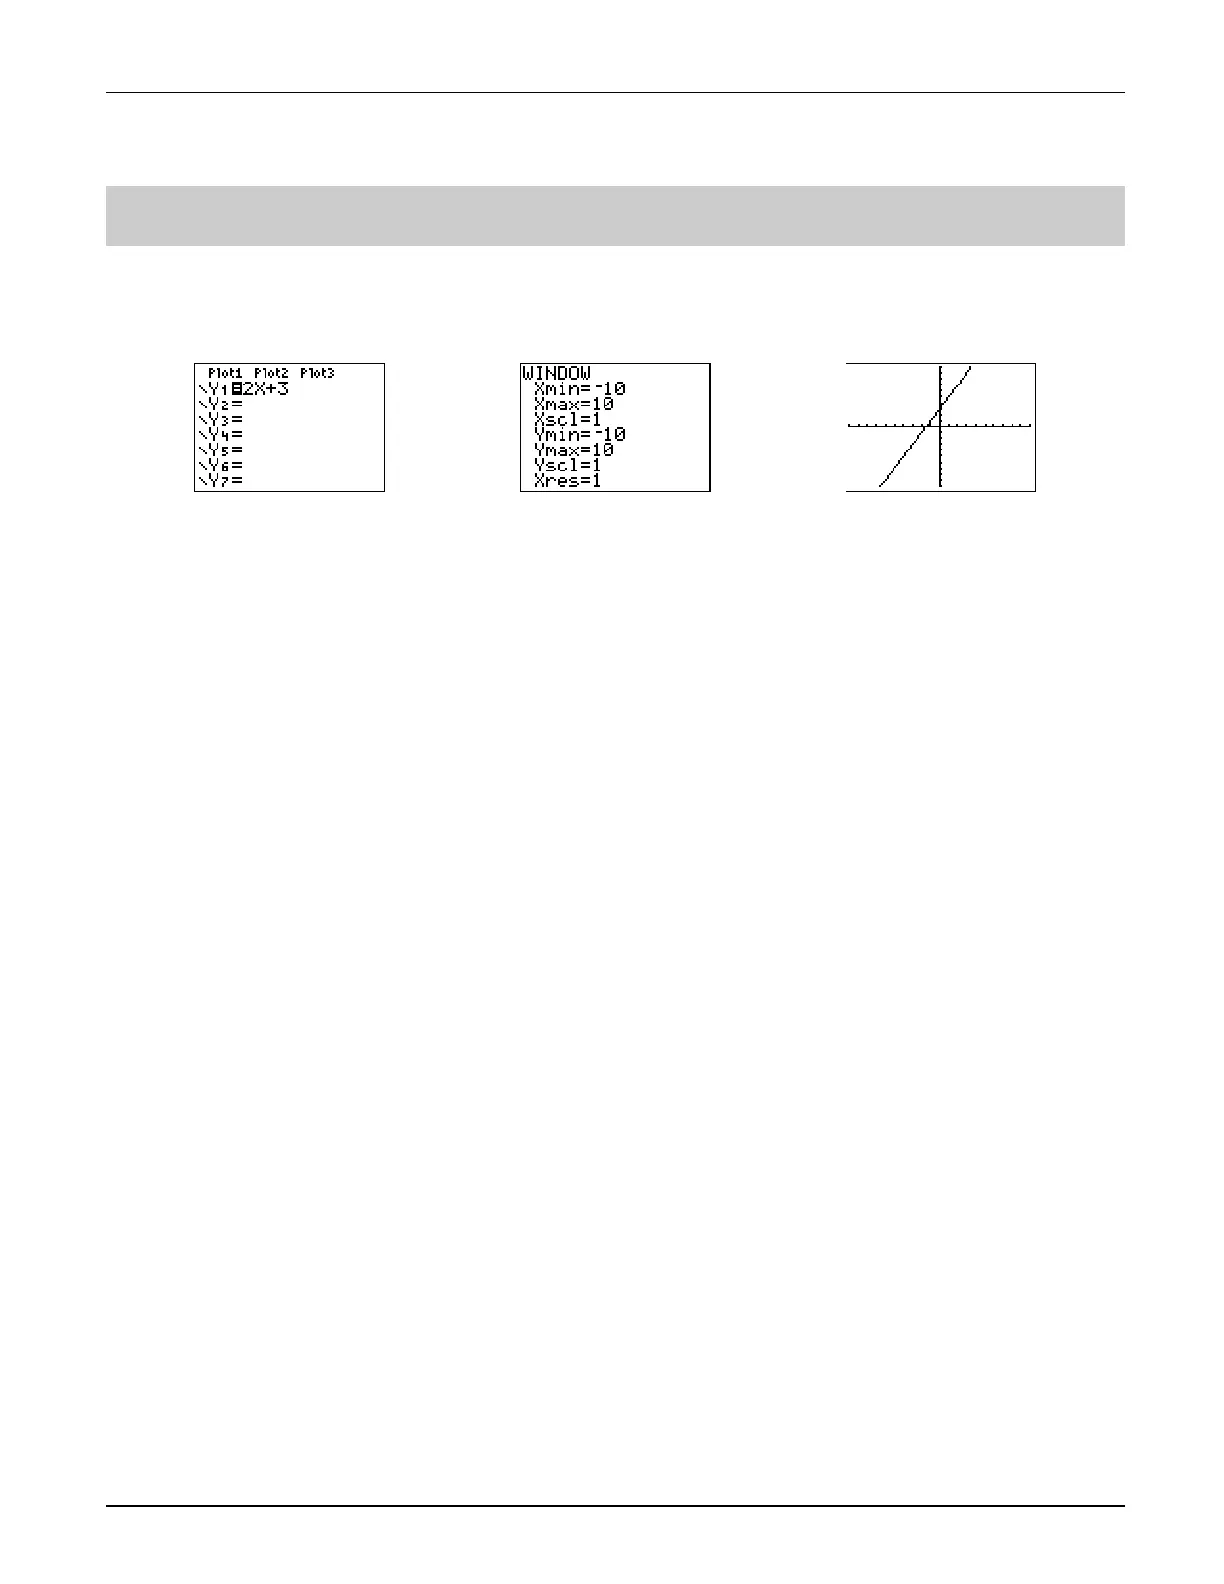
Y
1
=2x+3
in the Y= editor Standard Graphing Window Graph of
Y
1
=2x+3

 Loading...


