150 Chapter 9: Sequence Graphing
09SEQUEN.DOC TI-89/TI-92 Plus: Sequence Graphing (English) Susan Gullord Revised: 02/23/01 10:59 AM Printed: 02/23/01 2:14 PM Page 150 of 14
Using the predator-prey model in biology, determine the numbers of
rabbits and foxes that maintain population equilibrium in a certain
region.
R
= Number of rabbits
M
= Growth rate of rabbits if there are no foxes (use .05)
K
= Rate at which foxes can kill rabbits (use .001)
W
= Number of foxes
G
= Growth rate of foxes if there are rabbits (use .0002)
D
= Death rate of foxes if there are no rabbits (use .03)
R
n
=
R
n-1
(1 + M
ì
K W
n-1
)
W
n
=
W
n-1
(1 + G R
n-1
ì
D)
1. On the Y= Editor (
¥#
), define the sequences and initial values
for
R
n
and
W
n
.
u1(n) = u1(n
ì
1)
ù
(1 + .05
ì
.001
ù
u2(n
ì
1))
ui1 = 200
u2(n) = u2(n
ì
1)
ù
(1 + .0002
ù
u1(n
ì
1)
ì
.03)
ui2 = 50
2. Set
Axes = TIME
.
3. On the Window Editor
(
¥$
), set the Window
variables.
nmin=0. xmin=0. ymin=0.
nmax=400. xmax=400. ymax=300.
plotStrt=1. xscl=100. yscl=100.
plotStep=1.
4. Graph the sequence
(
¥%
).
5. On the Y= Editor, set
Axes = CUSTOM
,
X Axis = u1
, and
Y Axis = u2
.
6. In the Window Editor, change
the Window variables.
nmin=0. xmin=84. ymin=25.
nmax=400. xmax=237. ymax=75.
plotStrt=1. xscl=50. yscl=10.
plotStep=1.
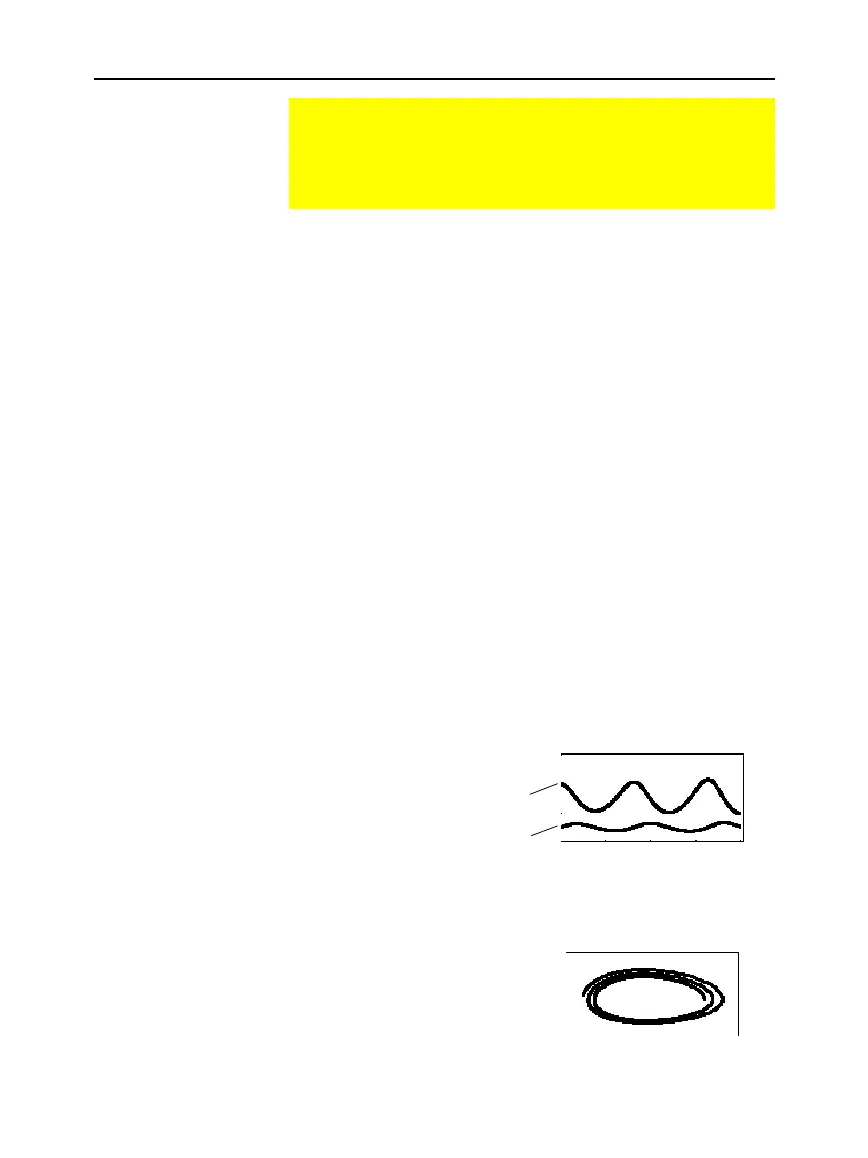
7. Regraph the sequence.
Using Custom Plots
CUSTOM axes give you great flexibility in graphing sequences.
As shown in the following example, CUSTOM axes are
particularly effective for showing relationships between one
sequence and another.
Example: Predator-
Prey Model
Note: Assume there are
initially 200 rabbits and
50 foxes.
Note: Use
…
to individually
trace the number of rabbits
u1(n) and foxes u2(n) over
time (n).
Note: Use
…
to trace both
the number of rabbits (xc)
and foxes (yc) over the
cycle of 400 generations.
u(n)
n
u2(n)
u1(n)
u1(n)
u2(n)

 Loading...


