Chapter 23: Activities 395
23ACTS.DOC TI-89/TI-92 Plus: Activities (English) Susan Gullord Revised: 02/23/01 1:24 PM Printed: 02/23/01 2:20 PM Page 395 of 26
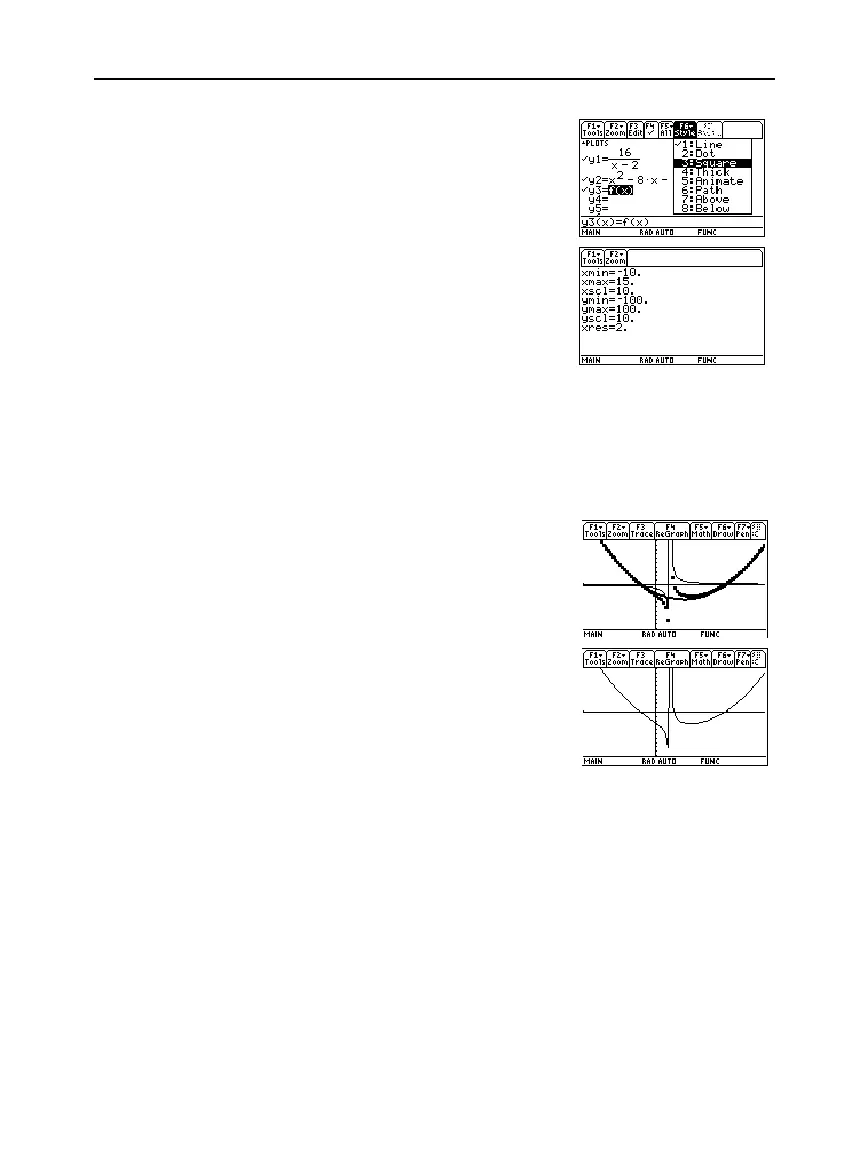
6. Add the original function
f(x)
to
y3(x)
and select the square
graphing style.
7. In the Window Editor, set the
window variables to:
x= [
ë
10,15,10]
y= [
ë
100,100,10]
8. Draw the graph.
Observe that the global behavior of the
f(x)
function is basically
represented by the quadratic quotient
y2(x)
. The rational expression
is basically a quadratic function as
x
gets very large in both the
positive and negative directions.
The lower graph is
y3(x)=f(x)
graphed separately using the line style.
Note: Be sure the Graph
mode is set to
Function.

 Loading...


