TABLE OF CONTENTS
ENEN
46
8. GUEST SCREENS
8.6 GRAPH screens
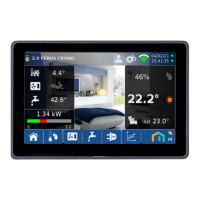
Pressing the icon accesses the graphs.
Screen 7.1 displays the GRAPH OF THE
TEMPERATURES, daily or weekly:
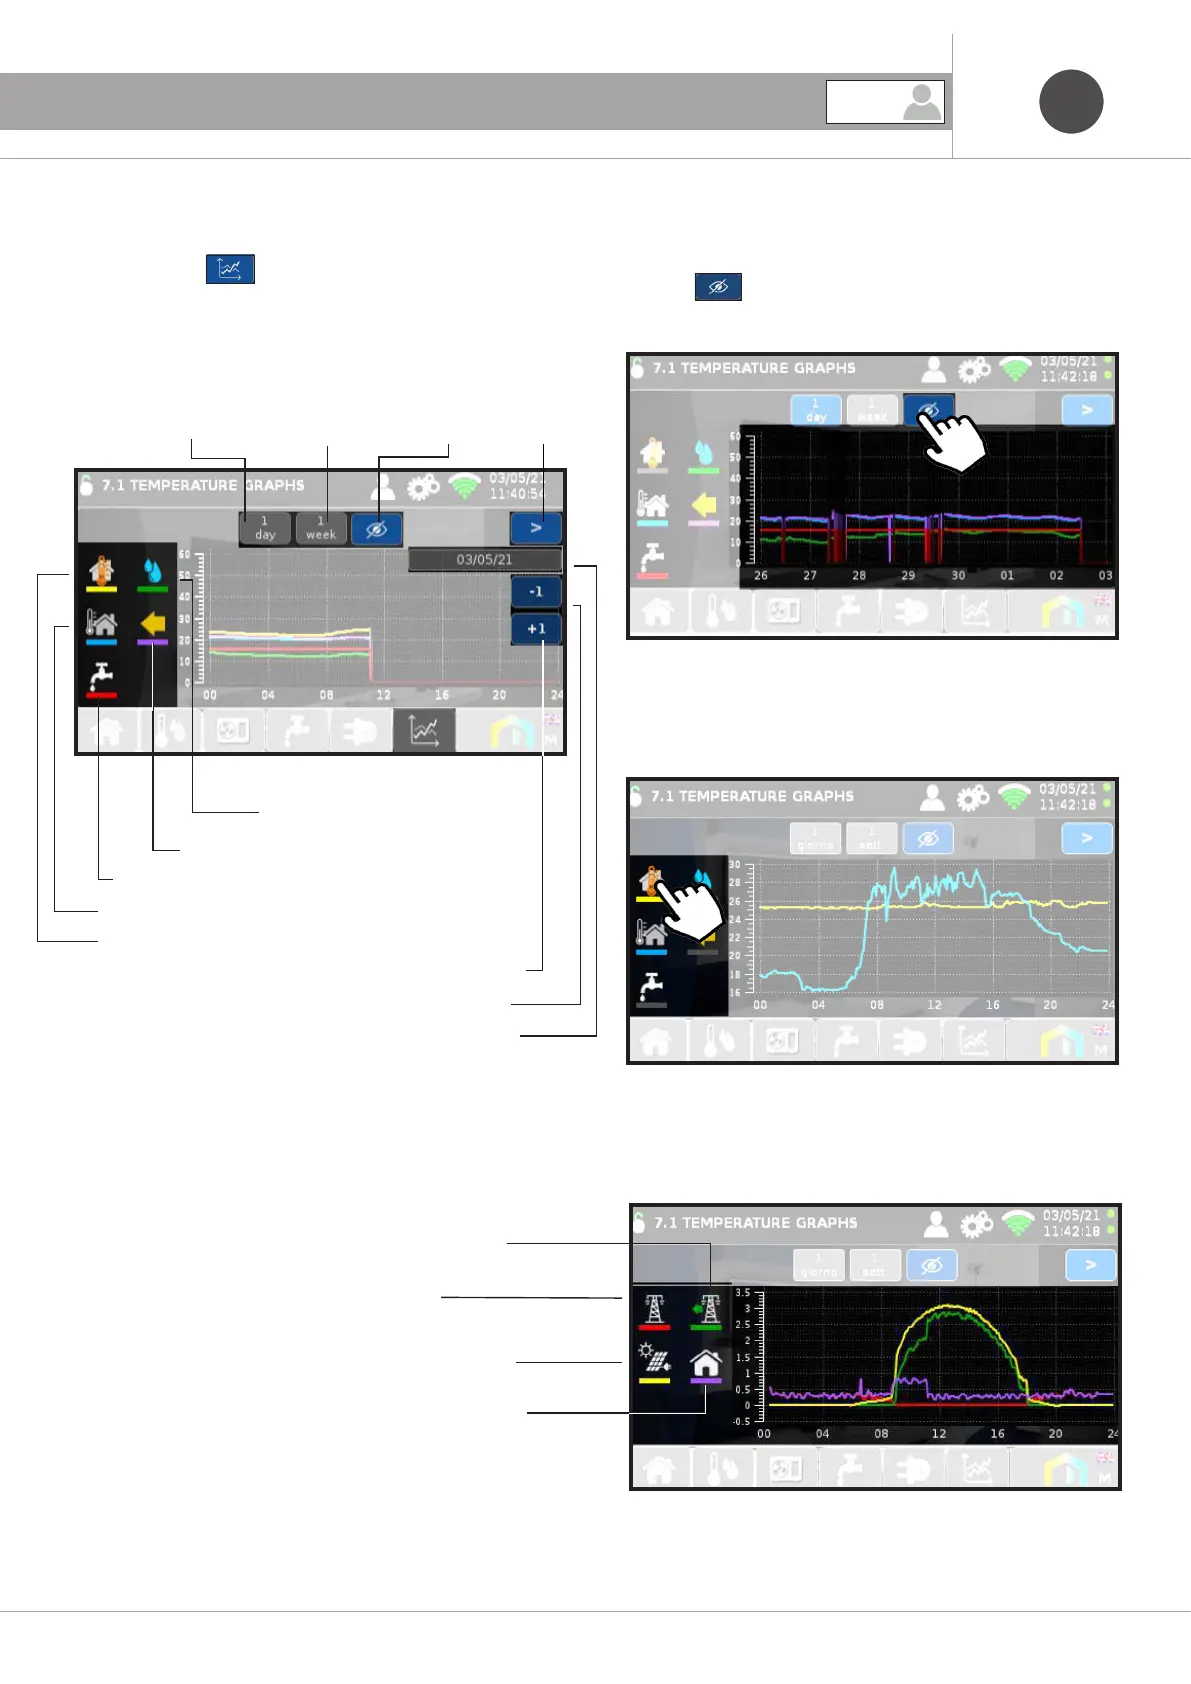
Screens 7.2 and 7.3 display the daily or weekly POWER GRAPHS:
Power input to the mains
Power taken from the mains
Power produced by the photovoltaic
Power consumed by the residence
Graph
daily
Graph
weekly
Hides period
Dew temperature
Internal room temperature
External temperature
Sanitary water temperature
Temperature of water entering the HP
Next
screen
Period displayed
Prior period
Next period
Pressing “Hide” the icons relative to the Period that hide
part of the graph are hidden.
By pressing the icons on the left you can deselect
the display on the graph. The Y-axis executes autorange.
GUEST
 Loading...