2. DISPLAY CATEGORIES AND CATEGORY SPECIFIC MENUS
2-15
2.11.3 Data which may be displayed in custom boxes
The table below shows the data which may be displayed in custom boxes and the box
sizes available when resizing the boxes.
*1: The average and maximum values are calculated from when the FI-70 is turned
on. All calculations for average and maximum are reset when the power is turned off.
*2: These items are shown in simplified format when displayed in the custom data
boxes.
Data type Displayed data
Box sizes available
(Height × Width)
Speed STW SOG 1×1, 1×2, 2×2, 3×2
STW Max*
1
SOG Max*1
STW Avg.*1 SOG Avg.*1
VMG
3-Axis Speed 2×1, 2×2, 3×2
Wind AWS AWA 1×1, 1×2, 2×2, 3×2
TWS TWA
TWS Max*1 Beaufort
GWD M(T)
Heading HDG M(T) HDG Tack M(T) 1×1, 1×2, 2×2, 3×2
HDG Avg. M(T)*1 ROT
Course COG M(T) 1×1, 1×2, 2×2, 3×2
Navigation BRG M(T) Odometer 1×1, 1×2, 2×2, 3×2
RNG ETA Time
Trip
WPT POSN 1×1, 1×2
XTE
1×1, 2×1*
2
, 1×2, 2×2*
2
, 3×2*
2
ETA Date 1×1, 1×2, 2×2
Boat Rudder 1×1, 1×2, 2×2, 3×2
Trim Tabs
2×1*
2
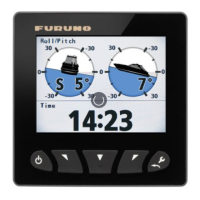
Roll/Pitch
2×2*
2
Heave 1×1, 1×2, 2×1, 2×2
Engine Engine RPM Fuel Used 1×1, 1×2, 2×2, 3×2
Eng. Trim Fuel Rate
E Load Eng. Hour
Gear Oil P Gear Oil T
1×1*
2
, 2×1*
2
, 1×2, 2×2, 3×2
Boost Eng. Temp.
Oil Temp. Oil Press.
Coolant P
Tank T1 thru T6 tank information
1×1*
2
, 2×1*
2
, 1×2, 2×2, 3×2
Depth Depth 1×1, 1×2, 2×2, 3×2
Environment Date 1×1, 1×2, 2×2
A Press. 1×1, 1×2, 2×2, 3×2
Time Humidity
W Temp. Wind Chill
A Temp. Dew Point
Voltage Volts
1×1*
2
, 2×1*
2
, 1×2, 2×2, 3×2
OFF Blank data box 1×1
 Loading...