Version 1.0, 12/2022. Copyright 2012 Hitron Technologies
37
Version 1.0, 12/2022. Copyright 2022 Hitron Technologies
37
Hitron CODA-57/57-EU User’s Guide
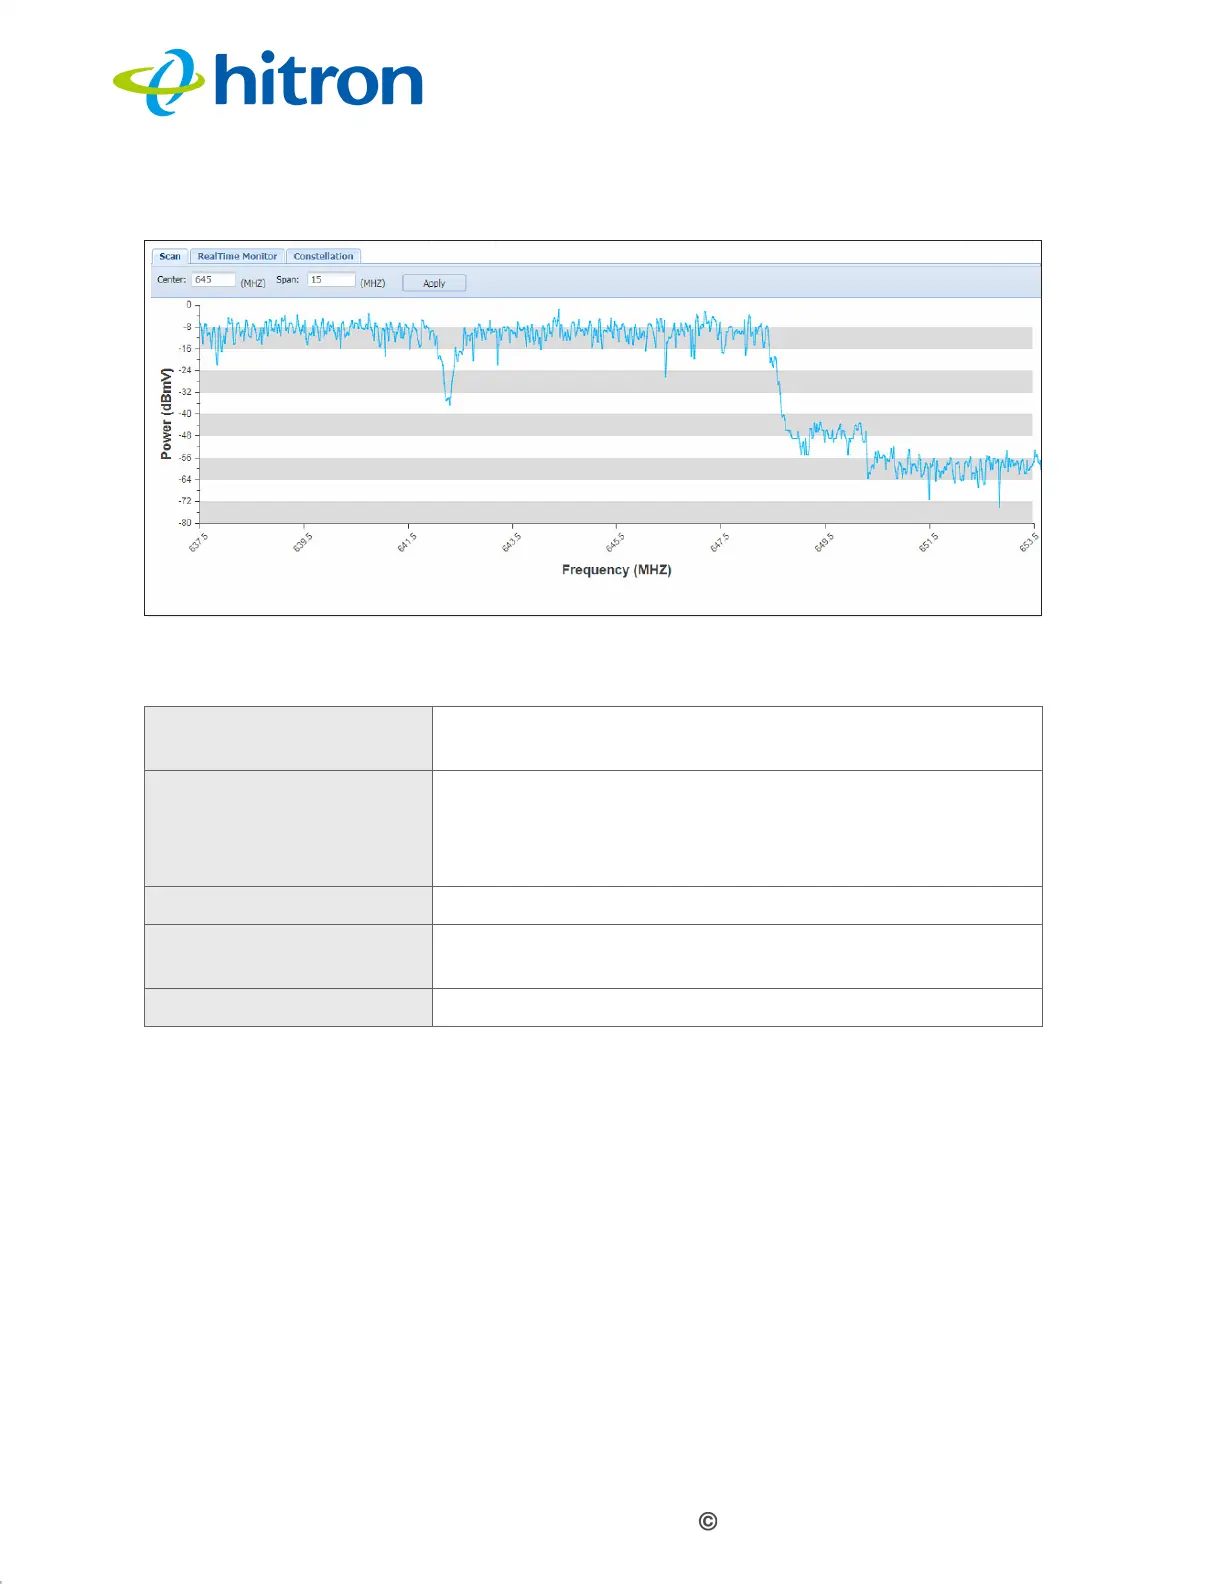
Figure 12: The Spectrum Scan Screen
The following table describes the labels in this screen.
2.7.2 The Spectrum RealTime Monitor Screen
Use this to observe fluctuations in the RF signal spectrum as they happen.
Click the RealTime Monitor tab in the System: Spectrum screen. The following
screen displays.
Table 13: The Spectrum Scan Screen
Center Enter the center frequency for the scan, in megahertz
(MHz).
Scan Enter the bandwidth of the scan, in megaherts. For
example, if you set a Center frequency of 645MHz and
a Scan bandwidth of 15 MHz, the system will scan the
band 637.5~652.5 MHz.
Apply Click this to start the scan.
Power (dBmV) This displays the signal power in decibels relative to one
millivolt.
Frequency (MHZ) This displays the signal frequency in megahertz.
 Loading...