D-0120588-B – 2019/03
Eclipse – Instructions for Use - EN Page 102
8.6 Making an ABRIS recording
8.6.1 Starting & pausing a test
Click on the Start button to start testing.
Click on Stop to stop testing.
Click on Pause during testing to pause the measurement.
Press Resume to resume the test.
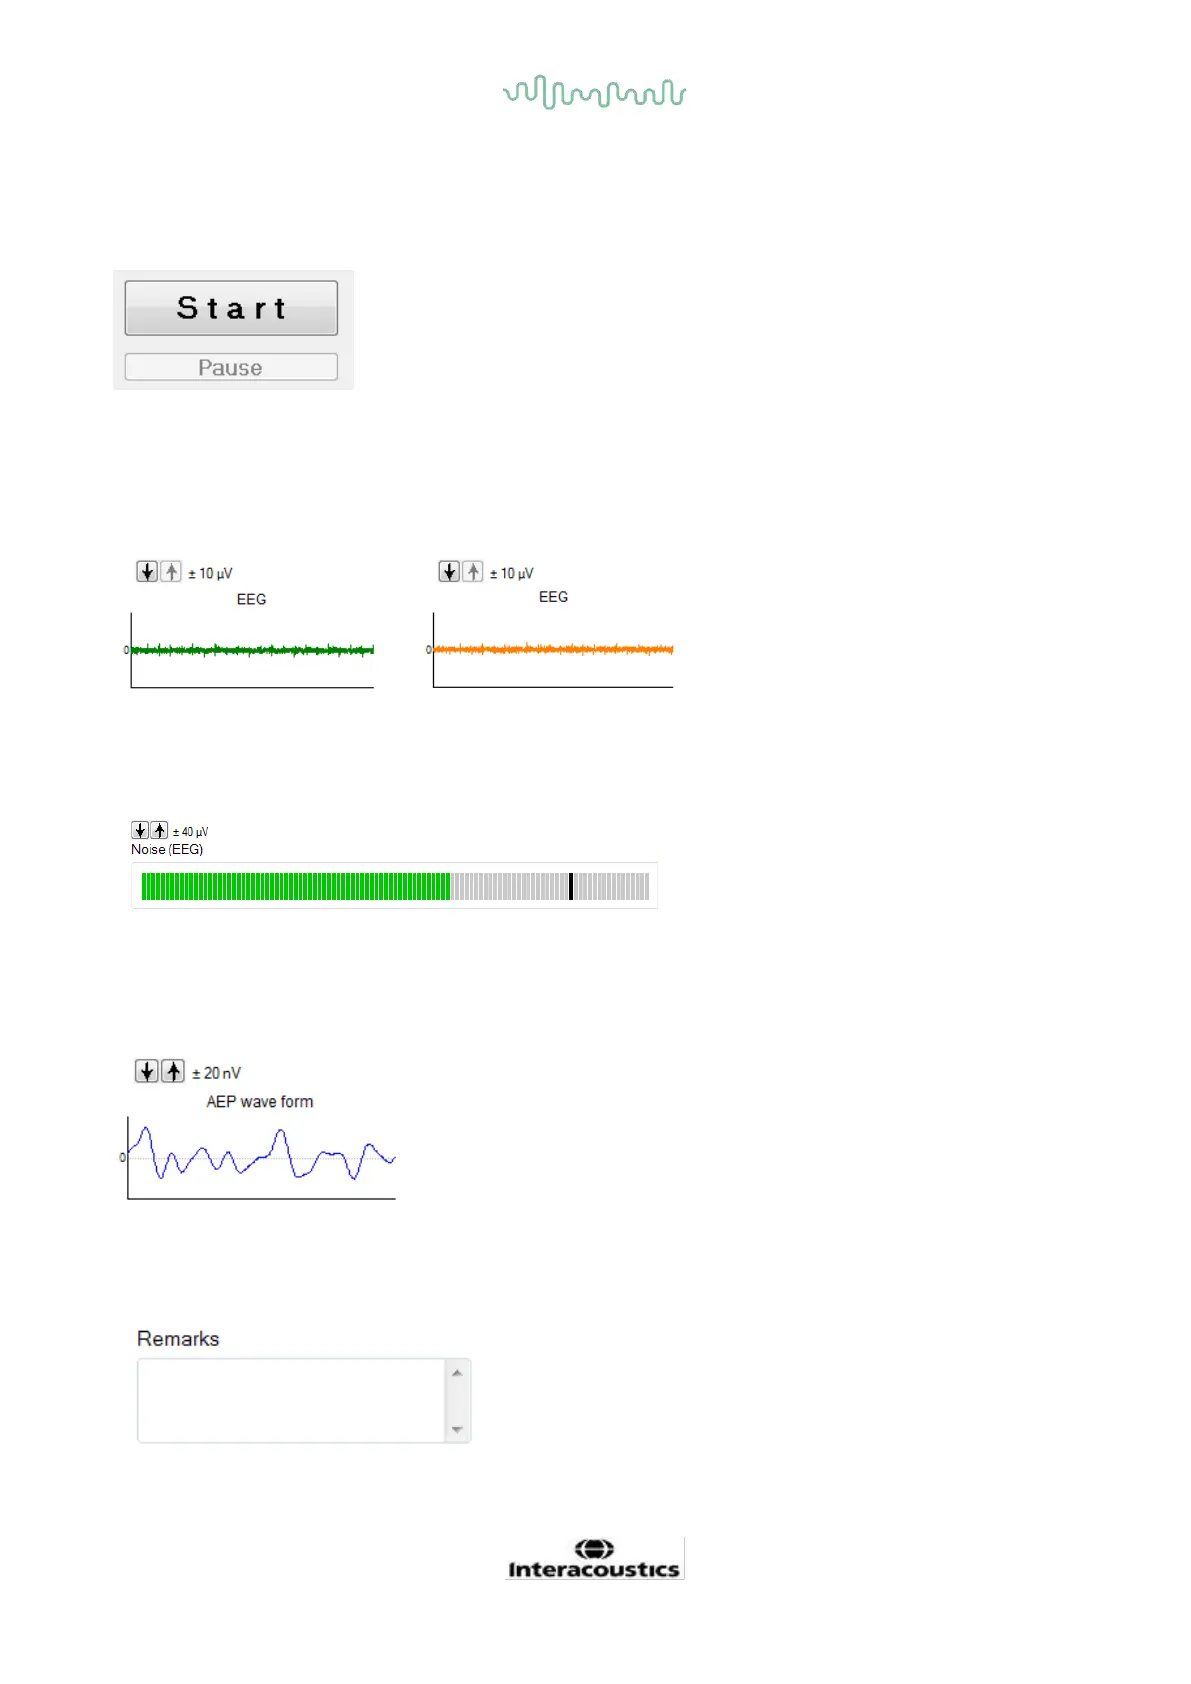
8.6.2 EEG graph
Displays the ongoing raw EEG. The graph will turn amber or red when measurements are rejected (too
much noise). Adjust the rejection level by using the arrows above the EEG graph.
8.6.3 EEG noise bar
The EEG Noise Bar can be displayed instead of raw EEG Graph. When the noise is below the black line,
the VU meter is green. When the VU meter turns red, this indicates that the noise is too high (poor electrode
contact or restless baby). Adjust the rejection level by using the arrows above the EEG Noise Bar.
8.6.4 AEP waveform
The AEP waveform is displayed during testing. Due to the nature of the stimulus and algorithm (ASSR), this
cannot be compared to traditional ABR waveforms.
8.6.5 Remarks box
Add test session comments in the Remarks box.

 Loading...