Chapter 1. How to Use the MilTouch
™
Control
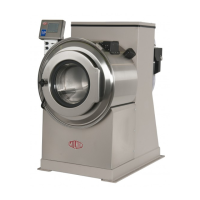
1.1.2.2. The Machine Status Data
e Status Data
Figure 16 Legend
Figure 18: The Machin
Zone B from
A. Status bar for formula
B. Water level achieved
C. Machine data area
.
D. Water temperature
achieved
E. Operation indicators
F. Water valve indicators
G. Chemical signals and
chemical flush valve
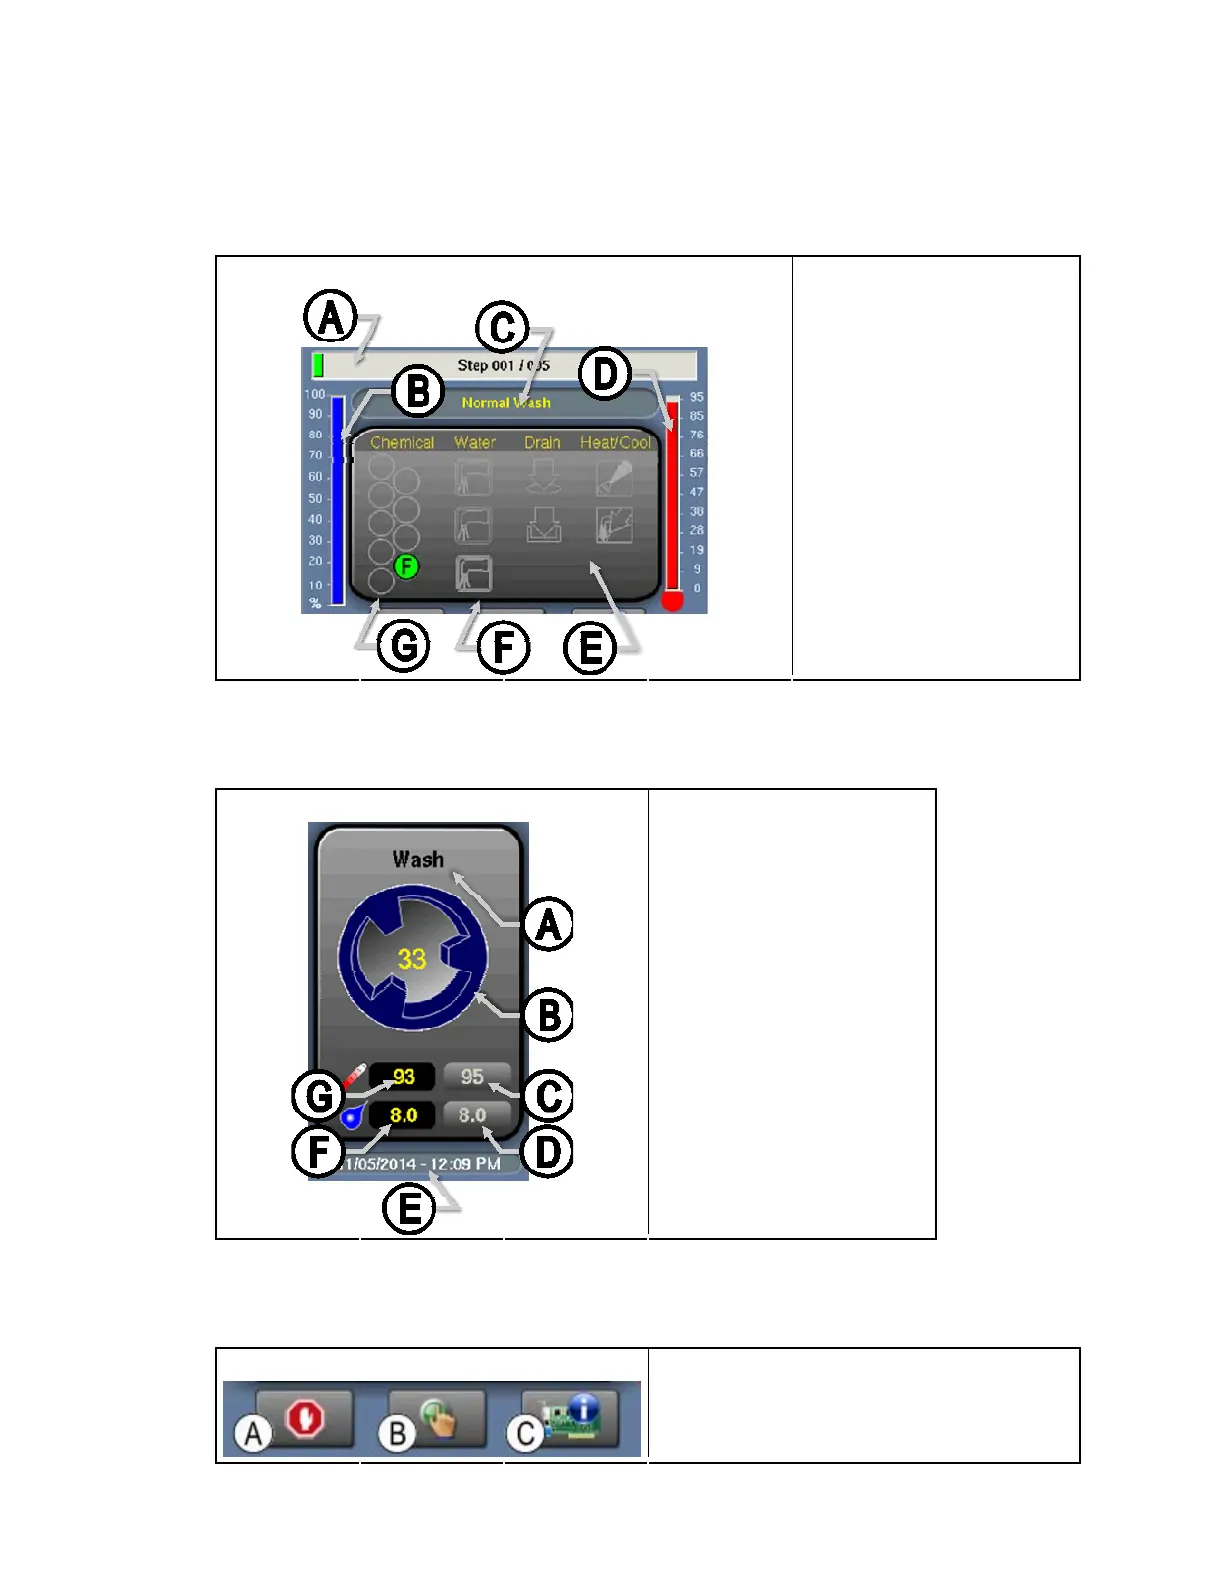
1.1.2.3. tions
Figure 19: The Machine Operatio
Zone C from Figure 16 Legend
The Machine Opera
ns
.
A. Step name
B. Cylinder motion
C. Desired water temperature
D. Desired water level
E. Date and time
F. Water level
G. Water temperature
1.1.2.4. The Standard and Pop-up Controls on the Run Display
Figure 20: Standard Controls
Zone D from Figure 16 Legend
.
C. Diagnostics
A. Cancel formula
B. Manual controls activation
PELLERIN MILNOR CORPORATION
23
 Loading...