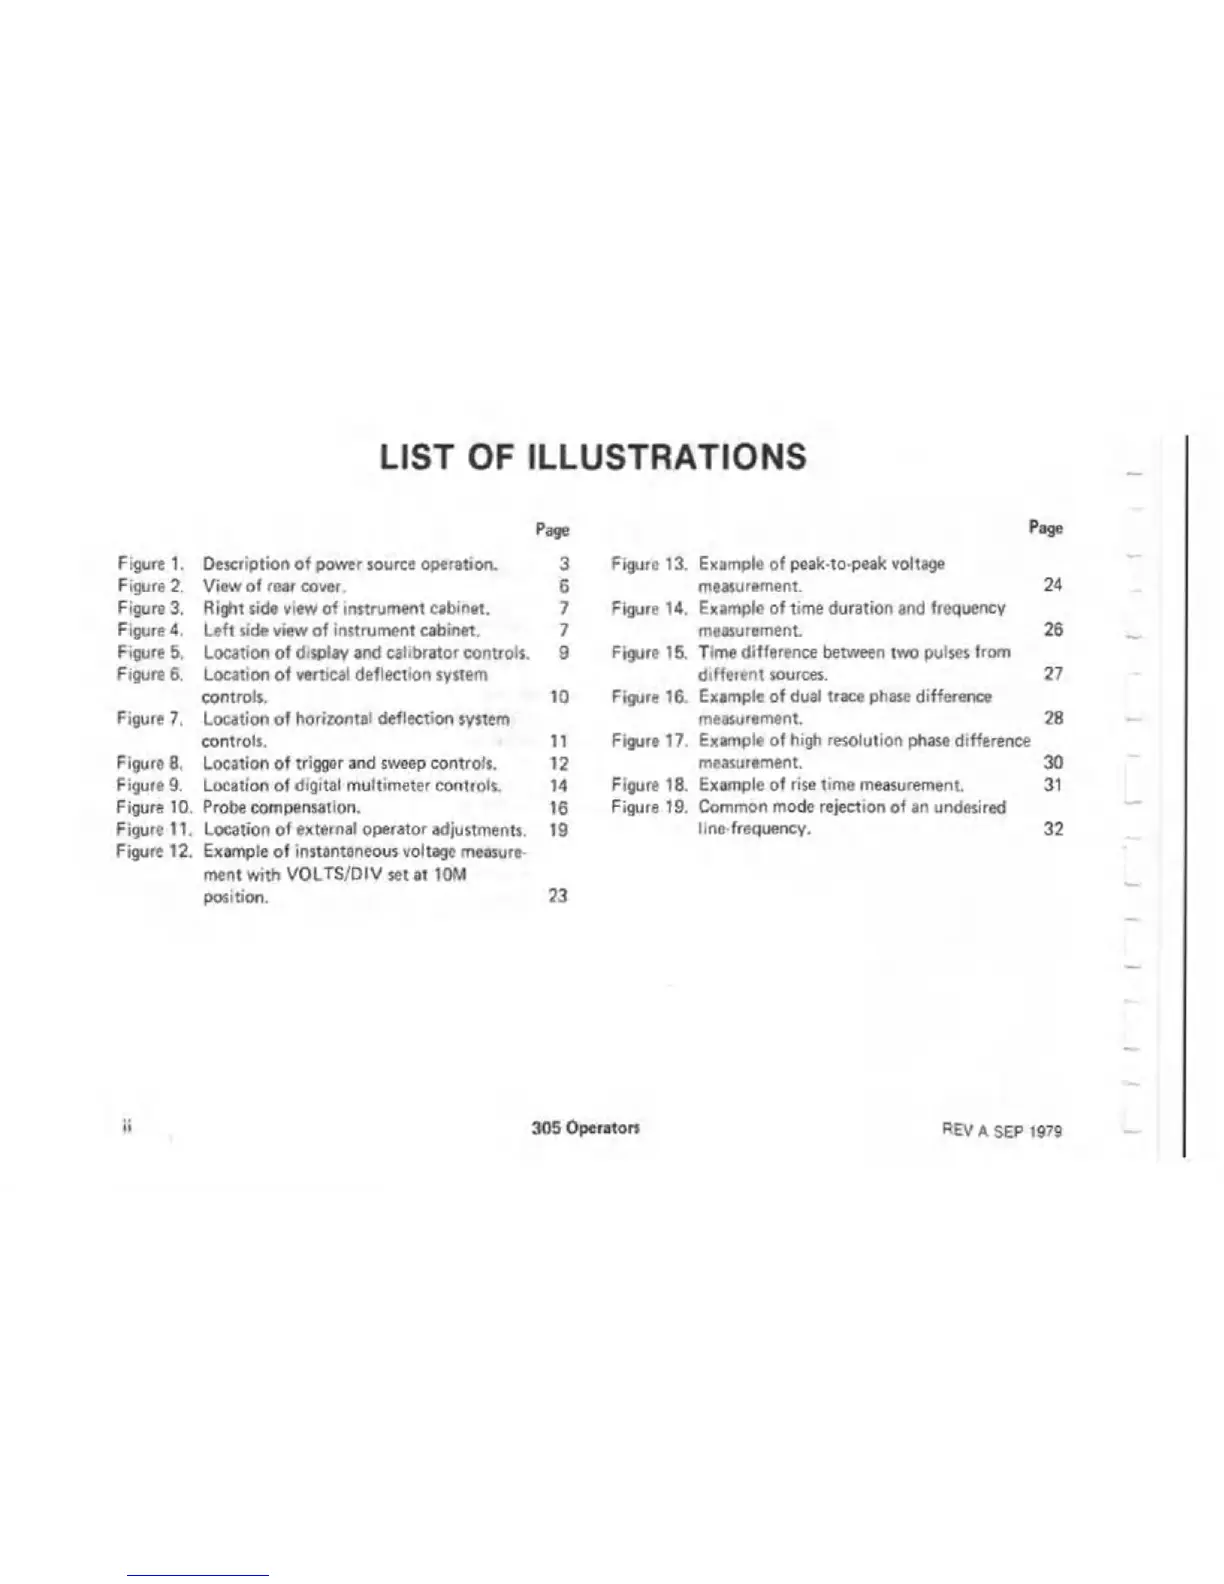
LIST OF ILLUSTRATIONS
Page
Page
Figure 1. Description o f power source operation.
3
Figure 13. Example of peaktopeak voltage
Figure 2. View of rear cover.
6
measurement.
24
Figure 3.
Right side view of instrument cabinet. 7 Figure 14. Example of time duration and frequency
Figure 4. Left side view of instrument cabinet.
7 measurement
26
Figure 5. Location of display and calibrator controls.
9
Figure 15. Time difference between two pulses from
Figure 6. Location o f vertical deflection system
different sources. 27
controls. 10
Figure 16. Example of dual trace phase difference
Figure 7. Location of horizontal deflection system measurement. 28
controls.
11
Figure 17. Example of high resolution phase difference
Figure 8.
Location of trigger and sweep controls.
12
measurement. 30
Figure 9. Location of digital multimeter controls.
14
Figure 18. Example of rise time measurement. 31
Figure 10. Probe compensation.
16
Figure 19. Common mode rejection of an undesired
Figure 11.
Location of external operator adjustments.
19
line frequency.
32
Figure 12. Example of instantaneous voltage measure
ment with VOLTS/DIV set at 10M
position. 23
ii
305 Operators
REV A SEP 1979
 Loading...