44 Calculator Keystroke Guide
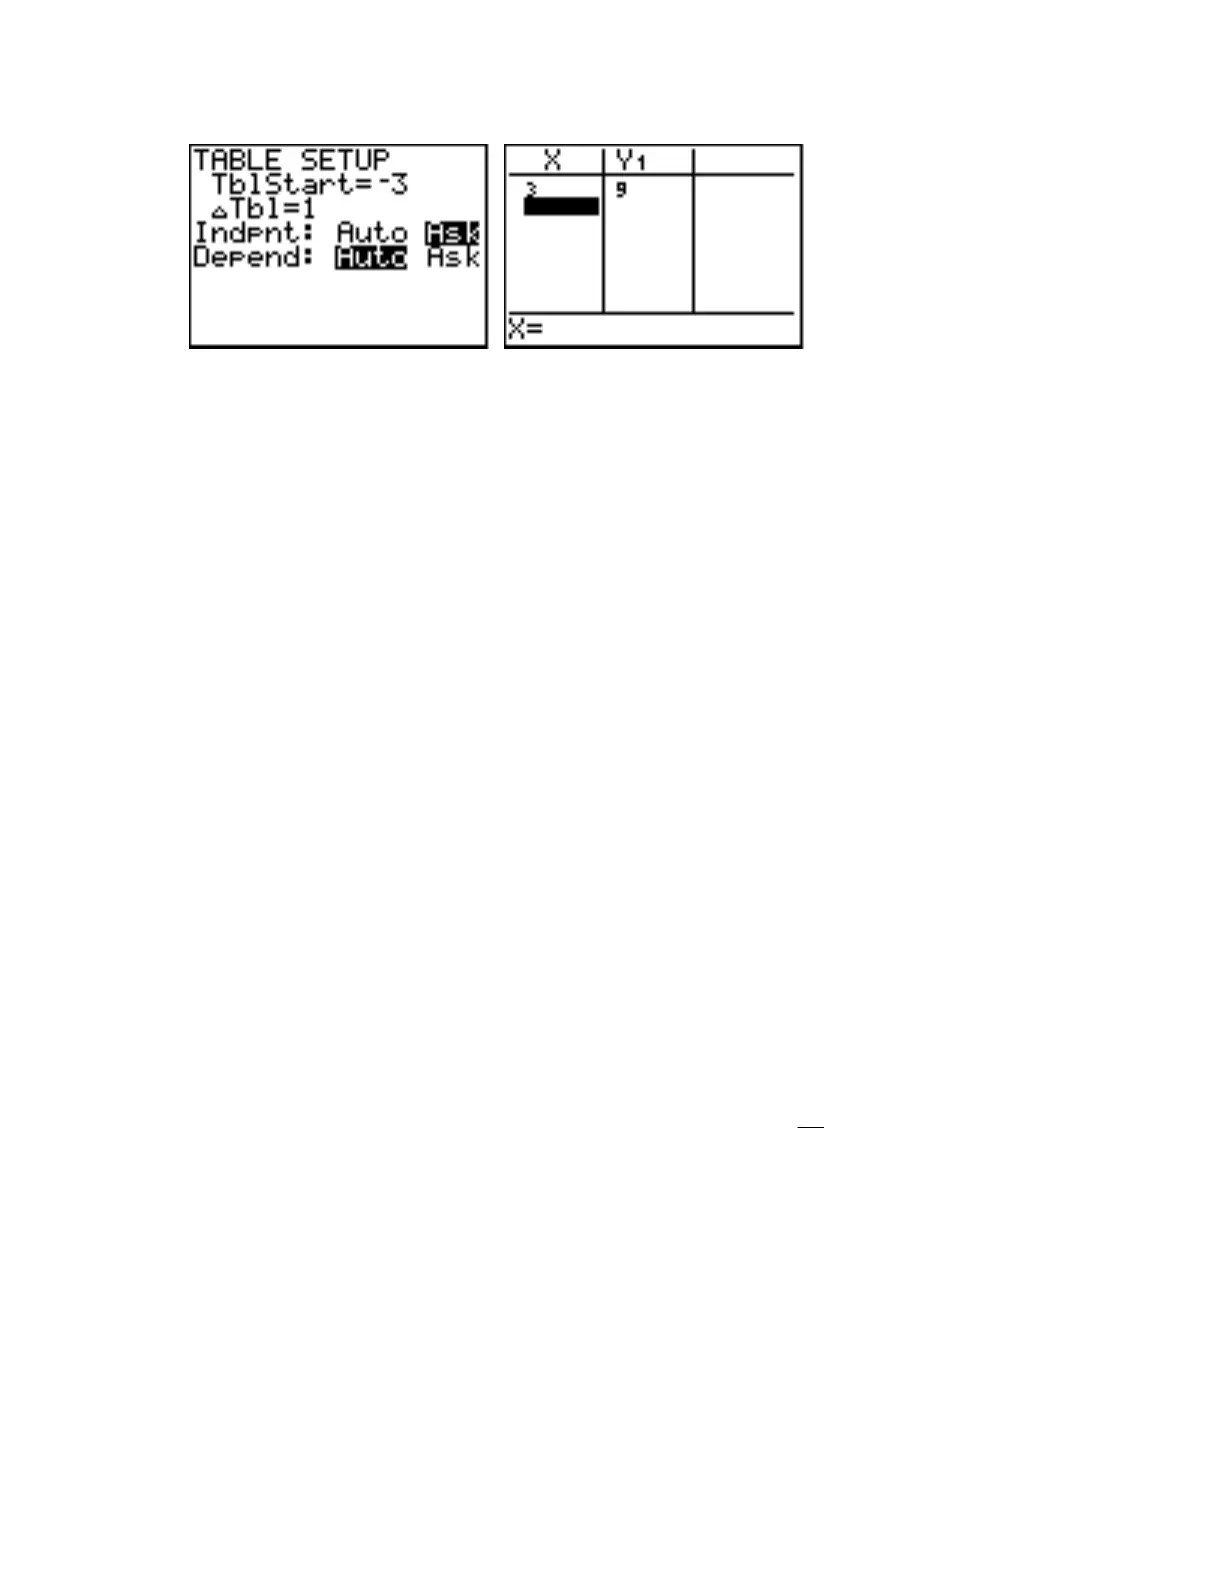
Now press 2nd [TABLE] (the second function on the GRAPH key) to display a table. Type in any
value of x you want, such as 3 in the example above. Press ENTER to see the value of Y1 (and any
other Y's you may have) displayed in the table. Choose any other values of x you want and use the
same procedure to evaluate your Y-variables.
page 94
23 Trace
When you have displayed a graph of an equation, you may trace along points on the graph by
using the Trace cursor. For example, clear out any old equations from the Y= screen and enter as
Y1 the expression
. To get an Integer graphing window (see 17 Integer) on your calculator
which corresponds most closely to the graphing window shown in Figure 2.18 on page 94 in the
text, first press ZOOM 6 to get the Standard (default) viewing window. Then press ZOOM 8, and
with the cross-hair cursor still near the origin, press ENTER to create the desired Integer graphing
window. (You may want to look at the Window settings to see that they are similar to—but not
exactly the same as—those shown in Figure 2.18, which are for a different calculator model.)
To activate the Trace cursor, press the TRACE key. A cursor will appear on the graph of the
equation, and the coordinates of the cursor will appear at the bottom of the screen. In the upper
left-hand corner of the screen you will also see the equation which is being traced. (If you do not
see the equation when you press TRACE, press 2nd [FORMAT] and be sure that ExprOn is
highlighted.) To move the cursor along the graph and display the coordinates of other points on
the graph, use the Left and Right Arrow keys. Unlike the general cursor (see 19 Cursor), the
Trace cursor always stays on the graph and displays only coordinates of points which are on the
graph. To turn the Trace cursor off, press GRAPH.
If more than one graph is displayed, the Trace cursor may be made to trace along each graph
listed on the Y= screen. For example, go to the Y= screen. Keep the expression already entered as
Y1. Enter as Y2 the expression
112
x
. Enter as Y3 the expression 18
2
−
x
. Press GRAPH to
see all three graphs displayed. Press the TRACE key to activate the Trace cursor. The Trace cursor
will appear on the graph of Y1, as it did before. To make the Trace cursor move to the other
straight-line graph, the graph of Y2, press the Down Arrow key. Move the Left and Right Arrow
keys to trace along the graph of Y2. To make the Trace cursor move to the curved graph of Y3,
press the Down Arrow key again. Move the Left and Right Arrow keys to trace along the graph of
Y3. If you press the Down Arrow key once more, the Trace cursor will cycle back to the graph of
Y1. (If four graphs were displayed, the Trace cursor would have moved to the graph of the fourth
equation.) Pressing the Up Arrow key makes the Trace cursor move from graph to graph in
reverse order. While the Trace cursor is on, try pressing the Up Arrow key a few times to see how
the Trace cursor moves from graph to graph.

 Loading...


