EasyManua.ls Logo

Texas Instruments TI-85 User Manual

Texas Instruments TI-85
28 pages
To Next Page IconTo Next Page
To Previous Page IconTo Previous Page
Page #9 background imageLoading...
Page #9 background image
The Greatest Integer Function
Find the greatest integer function, called the int func-
tion on the TI-82. Use this function to write C(x) in
the Warm-Up Exercise 4 of Section 1.1 in the text.
int(x) is the greatest integer less than or equal to x.
Thus, int(5.03) = 5 and int(7.8) = 7. So C(x) =
0.07int(x) + 0.10. This is easier to graph than using
the more complicated piecewise input.
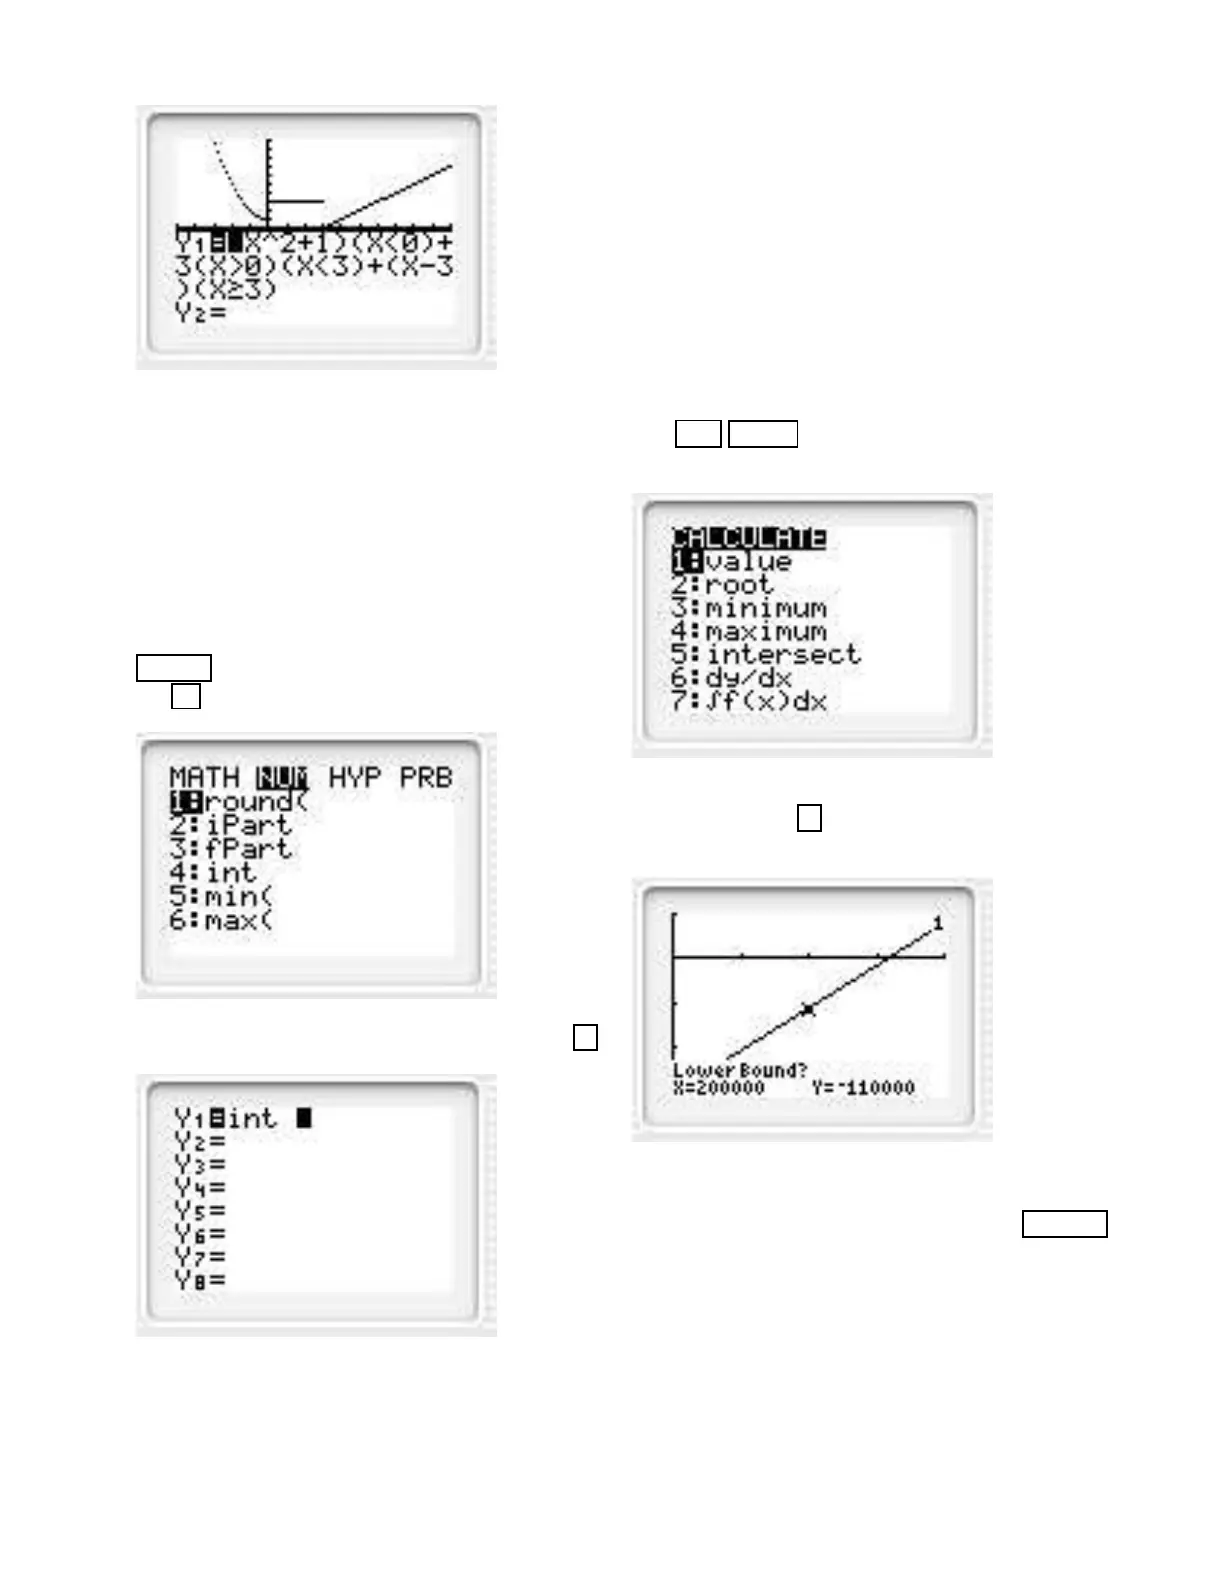
Solution. Obtain the int function by first pressing the
MATH key. Now select the NUM menu by pressing
the key.
Now select the int function by pressing the key 4 .
Section 1.2 in Text
The root Operation
The intersect Operation
The root Operation
Find where the function y1 = 0.95x 300, 000 is zero.
Refer to Example 2 and Exploration 1 in the text.
Solution. First graph y1 using a screen with dimen-
sions [0, 400000] by [300000, 100000]. Now press the
keys 2nd CALC and you see the following.
Now press the key 2 and you obtain the following.
You are asked for a Lower bound. This means place the
cursor to the left of the zero. Press the key ENTER
and obtain the following.
38

Other manuals for Texas Instruments TI-85

Question and Answer IconNeed help?

Do you have a question about the Texas Instruments TI-85 and is the answer not in the manual?

Texas Instruments TI-85 Specifications

General IconGeneral
BrandTexas Instruments
ModelTI-85
CategoryCalculator
LanguageEnglish

Summary

Section 1.0 in Text: Graphing Basics

The Viewing Window Explained

Defines and illustrates the calculator's viewing screen boundaries (Xmin, Xmax, Ymin, Ymax).

Graphing in Standard Viewing Window

Instructions for graphing a function in the default viewing window settings.

Adjusting Viewing Window and Trace

Change Viewing Window Dimensions

Steps to adjust the viewing window parameters for graphing.

Using the TRACE Feature

How to use the TRACE feature to find points on a graph.

Section 1.1 in Text: Advanced Graphing

Piecewise Functions and Dot Mode

Graphing piecewise functions and using DOT mode for better display.

Section 1.2 in Text: Function Operations

The Root Operation for Zeros

Finding the x-intercept (zero) of a function using the calculator.

Finding Function Intersections

The Intersect Operation

Finding the point where two functions intersect.

Section 2.1 in Text: Statistics and Regression

STAT and LinReg for Data Analysis

Performing linear regression to find the best-fit line for data points.

Advanced Statistics and Table Generation

The TABLE Operation

Creating tables of function values by setting input parameters.

Function Evaluation and Program Execution

The Value Operation for Accuracy

Evaluating a function at specific x-values for high accuracy.

Executing Calculator Programs

Running user-defined or pre-loaded programs on the calculator.

Section 3.2 in Text: Tangents and Secants

Drawing Tangent Lines with DRAW

Using the DRAW menu to graph a tangent line to a function.

Section 5.2 in Text: Numerical Derivatives

nDeriv for First Derivatives

Calculating the numerical derivative of a function.

Chapter 12 Project: Predator and Prey Dynamics

Troubleshooting Calculator Issues

Related product manuals