EasyManua.ls Logo

Texas Instruments TI-85 User Manual

Texas Instruments TI-85
28 pages
To Next Page IconTo Next Page
To Previous Page IconTo Previous Page
Page #6 background imageLoading...
Page #6 background image
The TRACE Feature
Find points on the graph of the previous example. Re-
call y = x
4
12x
3
+ x
2
2.
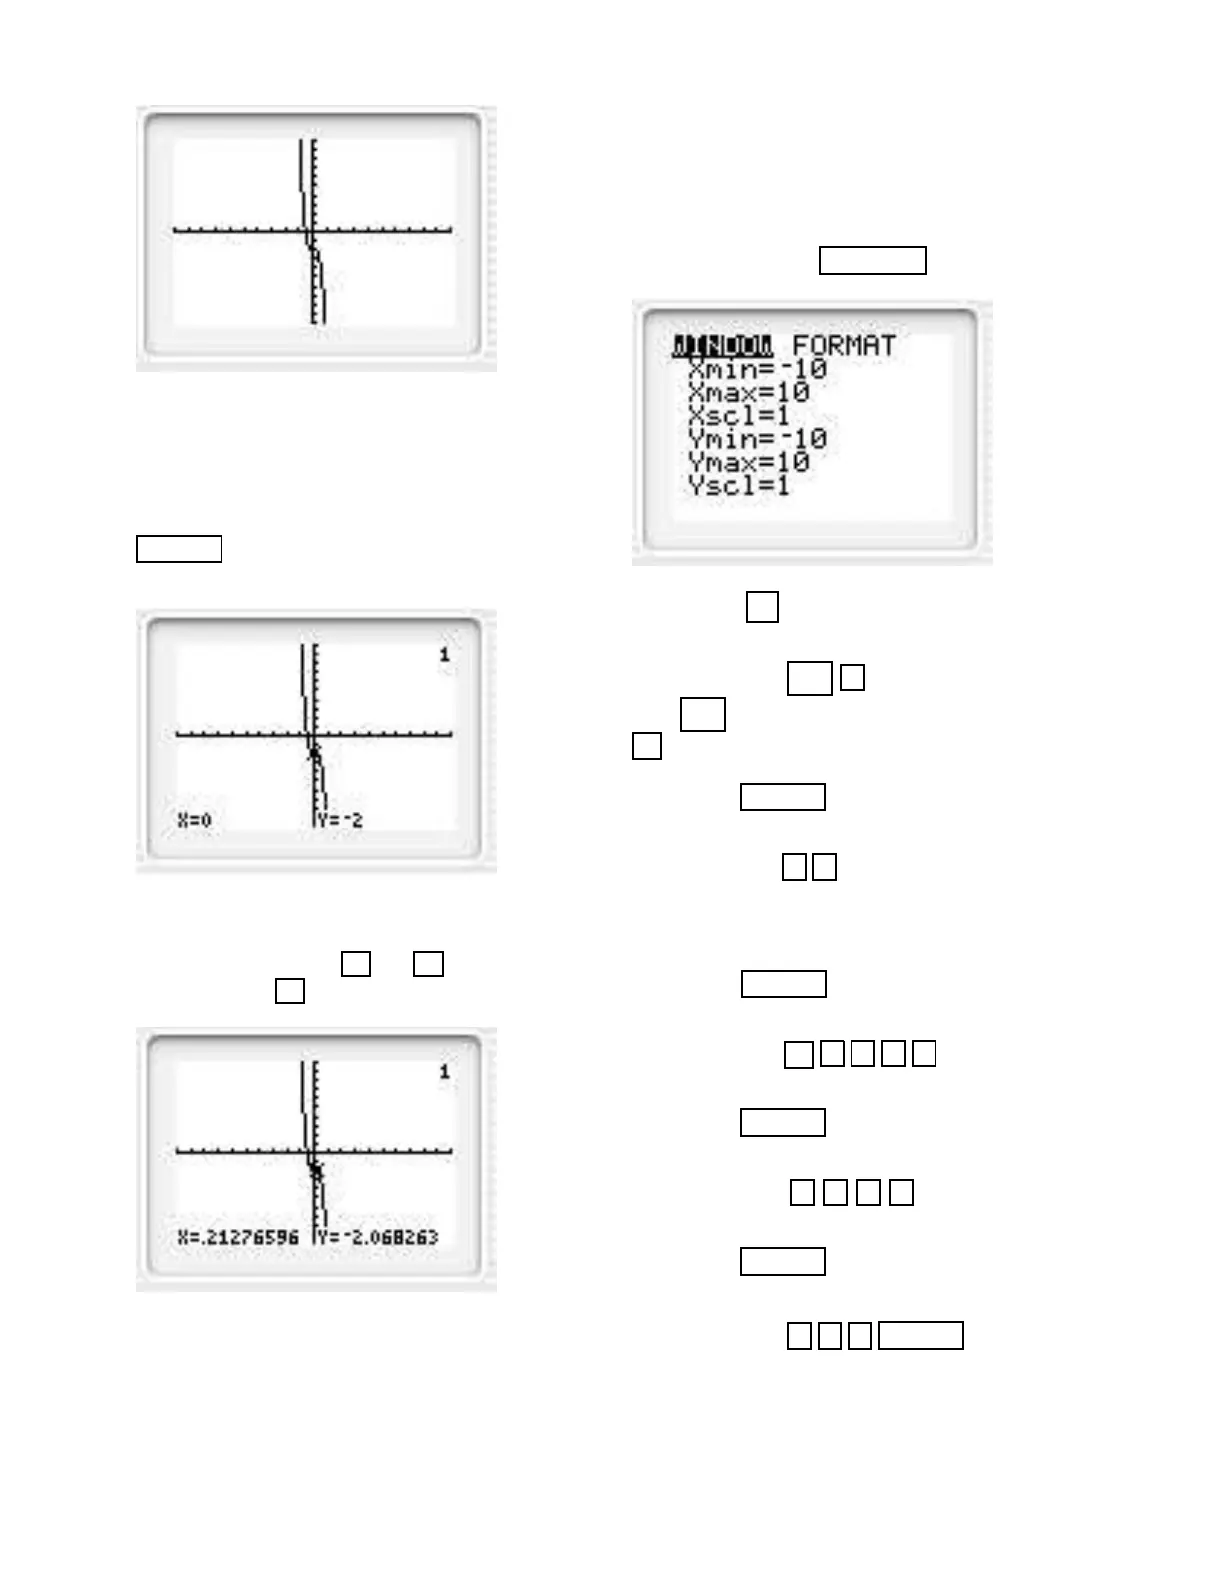
Solution. After graphing the function press the
TRACE key. A blinking star-like cursor will be sitting
on a point of the graph.
At the bottom you see x = 0 and y = 2. This means
that the point (0, 2) lies on the graph. You can move
the cursor by using the and keys. For example,
by pressing the key you obtain
This means that the (approximate) point
(0.21276596, 2.068263) is on the graph.
Change the Dimensions of the Viewing Window
Graph y = x
4
12x
3
+ x
2
2 using a window with di-
mensions [5, 14] by [2500, 1000]. (This is the second
part of Example 1 in the text).
Solution. Press the WINDOW key and you see
Press the 5 key and the blinking cursor moves
down to the 10 after Xmin.
Press the keys () 5 . This changes 10 to 5.
(The
() key is used to change the sign, whereas the
key is used to subtract two quantities.)
Press the ENTER key. The blinking cursor drops
to the 10 after Xmax.
Press the keys 1 4 . This changes 10 to 14
Notice that Xscl is 1. This means the tick marks on
the x-axis are set at 1 unit. We will not change this.
Press the ENTER key twice. The blinking cursor
drops to the 10 after Ymin.
Press the keys 2 5 0 0 . This changes 10
to 2500.
Press the ENTER key. The blinking cursor drops
to the 10 after Ymax.
Press the keys 1 0 0 0 . This changes 10 to
1000.
Press the ENTER key. The blinking cursor drops
to the 1 after Yscl. We need to set the tick (scale)
marks on the y-axis to a much larger number, say 500.
So press the keys 5 0 0 ENTER .
You should see the following.
35

Other manuals for Texas Instruments TI-85

Question and Answer IconNeed help?

Do you have a question about the Texas Instruments TI-85 and is the answer not in the manual?

Texas Instruments TI-85 Specifications

General IconGeneral
BrandTexas Instruments
ModelTI-85
CategoryCalculator
LanguageEnglish

Summary

Section 1.0 in Text: Graphing Basics

The Viewing Window Explained

Defines and illustrates the calculator's viewing screen boundaries (Xmin, Xmax, Ymin, Ymax).

Graphing in Standard Viewing Window

Instructions for graphing a function in the default viewing window settings.

Adjusting Viewing Window and Trace

Change Viewing Window Dimensions

Steps to adjust the viewing window parameters for graphing.

Using the TRACE Feature

How to use the TRACE feature to find points on a graph.

Section 1.1 in Text: Advanced Graphing

Piecewise Functions and Dot Mode

Graphing piecewise functions and using DOT mode for better display.

Section 1.2 in Text: Function Operations

The Root Operation for Zeros

Finding the x-intercept (zero) of a function using the calculator.

Finding Function Intersections

The Intersect Operation

Finding the point where two functions intersect.

Section 2.1 in Text: Statistics and Regression

STAT and LinReg for Data Analysis

Performing linear regression to find the best-fit line for data points.

Advanced Statistics and Table Generation

The TABLE Operation

Creating tables of function values by setting input parameters.

Function Evaluation and Program Execution

The Value Operation for Accuracy

Evaluating a function at specific x-values for high accuracy.

Executing Calculator Programs

Running user-defined or pre-loaded programs on the calculator.

Section 3.2 in Text: Tangents and Secants

Drawing Tangent Lines with DRAW

Using the DRAW menu to graph a tangent line to a function.

Section 5.2 in Text: Numerical Derivatives

nDeriv for First Derivatives

Calculating the numerical derivative of a function.

Chapter 12 Project: Predator and Prey Dynamics

Troubleshooting Calculator Issues

Related product manuals