unfolds note carefully the y-coordinates. You obtain
Screen 9.1. Repeat, if needed, and use T
step
= .03 to
speed up the graphing.
Section 10.3 in Text
Reproduce Screen 10.12
Solution. Set your calculator on parametric and dot
mode. Set x
1
= t, y
1
= (2t + 1)/t. For the range
variables set T
min
= 0, T
max
= 100, T
step
= 1, x
min
= 0,
x
max
= 100, y
min
= 1, y
max
= 3. Also set x
2
= t,
y
2
= 2. Graph, obtaining Screen 10.12.
Section 10.4 in Text
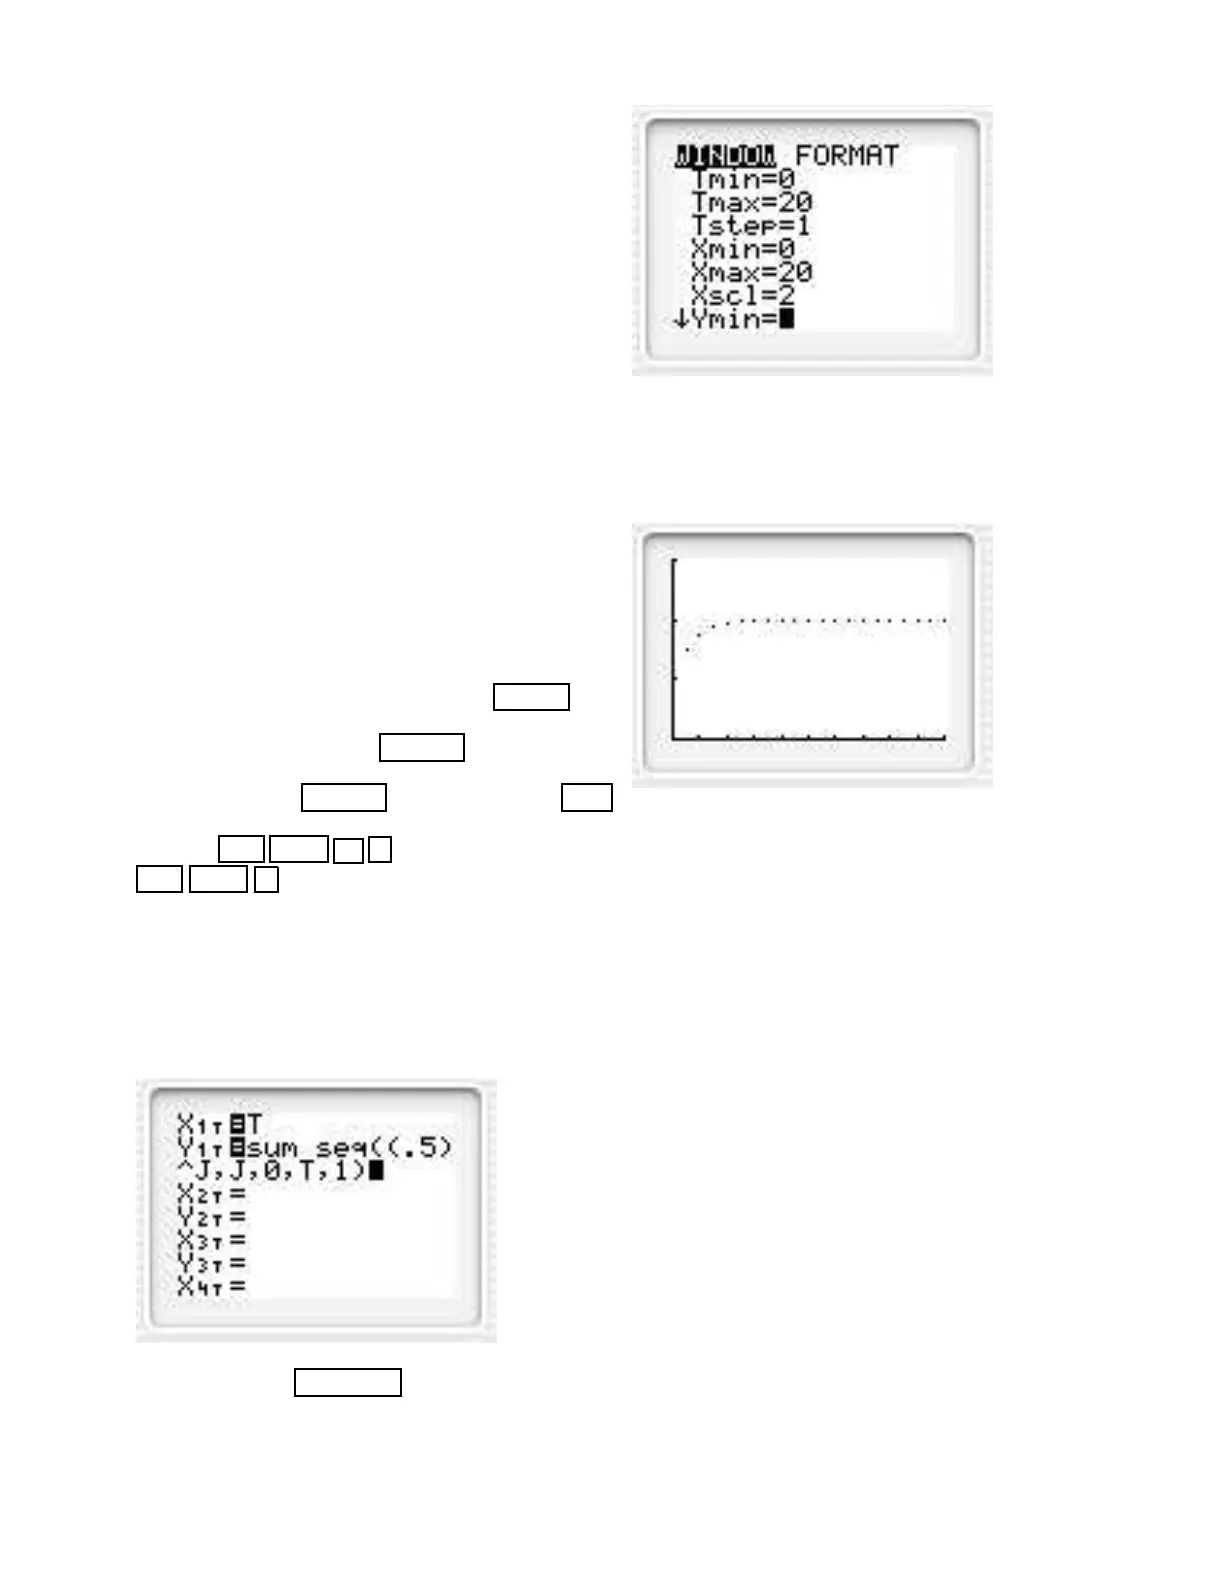
Graphing a Sequence
By graphing the partial sums on your graphing calcu-
lator give support to the conjecture that the series
1 + (0.5) + (0.5)
2
+ (0.5)
3
+ ···
converges to the sum 2. (Refer to Exploration 1 in the
text.)
Solution. Set the mode of your calculator to param-
eter and dot. Do this by pressing the
MODE key.
Move the blinking cursor so that the word Par is high-
lighted and then press the ENTER key. Now move
the blinking cursor so that the word Dot is highlighted
and then press the ENTER key. Now press the Y =
key and set x
1T
= T , y
1T
= sum seq((.5)
J
, J, 0, T, 1).
The keys 2nd LIST 5 gives sum, while the keys
2nd LIST 5 gives seq. We have
sum seq(a
J
, J, I, N, K) =
N
X
J=I
a
J
The K in the expression
sum seq(a
J
, J, I, N, K) means that J is incremented by
K in the sum.
Now press the WINDOW key and set Tmin= 0,
Tmax= 20, Tstep= 1, Xmin= 0, Xmax= 20, Ymin= 0,
Ymax= 3.
Graph. Notice that the sequence of partial sums ap-
pears to be converging to 2. Using the TRACE feature,
determine the values of the partial sums, and notice
that these numbers are approaching 2.
Section 11.1 in the text
• The Program RAND
• The Program RAND2
• Histograms
• Statistic
The Program RAND
The program RAND simulates a fair coin being flipped,
and graphs the relative frequency every P flips. Exe-
cute this program. (Refer to Exploration 1 in the text.)
Solution. Set the dimensions of the viewing window
to Xmin= 0, Xmax= 94, Ymin= 0.4, Ymax= 0.6, and
Yscl= 0.1. Execute the program RAND. The program
requests P . Use P = 100 or perhaps P = 50 for faster
action. The relative frequencies are graphed after every
P -flips. The following is one such graph, but every one
should be different.
If you wish, you can also keep track of the cumulative
number of “heads” and the numerical relative frequency
47

 Loading...


