DispG
DelVar τy1,τy2
exp1|y=τy2→exp2
exp1|y=τy1→exp1
augment(seq(expr("when("&string(exp1|x=xx)&",τy1,0)"),xx,xmin,xmax,„x*res),seq(e
xpr("when("&string(exp2|x=xx)&",τy2,0)"),xx,xmin+„x,xmax,„x*res))→tlist
augment(seq(x,x,xmin,xmax,res*„x),seq(x,x,xmin+„x,xmax,res*„x))→xlist
For τy1,ymin,ymax,„y*res
τy1+„y→τy2
PtOn xlist,tlist
EndFor
DelVar τy1,τy2
EndPrgm
This varies from Andrew's original program only in that the window corner coordinates are passed as
arguments, and the plot resolution can be set as a function argument as well. Specifically:
exp1: Expression to be plotted
xxmin, xxmax: Minimum and maximum x-coordinates
yymin, yymax: Minimum and maximum y-coordinates
res: Resolution for both x- and y-axes. res = 1 plots every display point, res = 2
plots every other point, etc.
Either version of the truth plot program can be very slow, especially when every pixel is tested using
res = 1 in truthd(). The 92+ LCD has 24,617 pixels, and the 89 display has 12,243 pixels. truth() is slow
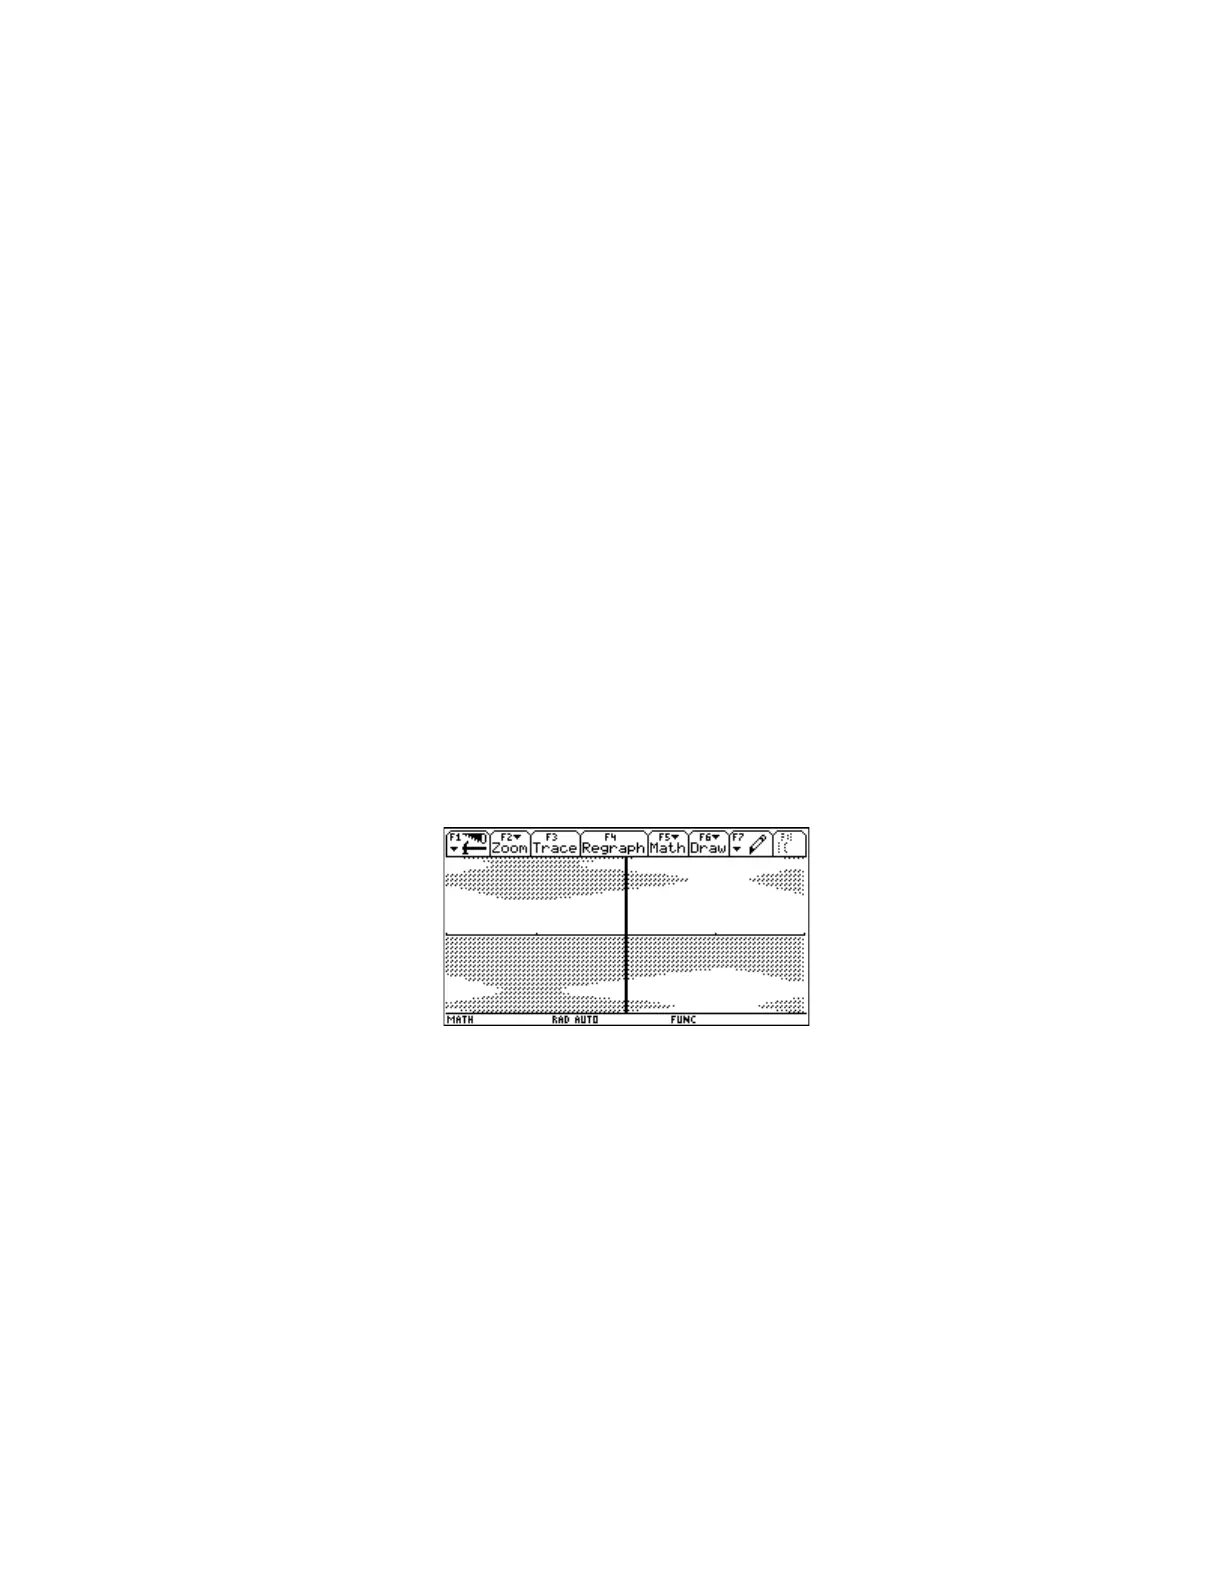
because the function has to be evaluated for each pixel. Setting res = 2 cuts the time in half, and larger
values of res reduce the time even more. This plot is for the function sin(x
2
)/x + cos(y
3
)/y < 0, for x and
y from -2 to 2, with res = 3. This plot finishes in a few minutes.
(Credit to Andrew Cacovean)
[4.4] Plot data and functions simultaneously
I frequently need to plot both data and a function on the same graph. This is useful when curve fitting
and testing interpolation methods. To do this within a program is not difficult, but the method is not
immediately obvious. The program below, plotdemo(), shows one way to do it.
plotdemo(xyspec,xyn,fplot,fpn)
prgm
©Demo program to plot xy-data & 1 function
©24dec99 dburkett@infinet.com
©xyspec: data points matrix or name
4 - 4
 Loading...


