1. Press [MODE] [RIGHT] [5] [ENTER] to select 3D graphing mode.
2. Press [Y=] and move the cursor to the desired z-plot; we'll use z1. Enter mat1[x,y] and press
[ENTER], so that plot z1 is checked, and the display shows z1 = mat1[x,y].
3. Press [WINDOW]. Move the cursor to xmin and enter 1. Move the cursor down to xmax and
enter 10, since the matrix has 10 rows. Move the cursor down to xgrid and enter 9, since xmax
- 1 = 9. Move the cursor down to ymin and enter 1. Move the cursor down to ymax and enter
10, since the matrix has 10 columns. Move the cursor down to ygrid and enter 9, since ymax -
1 = 9. Set zmin to 0, and set zmax to 230.3.
4. Press [GRAPH] to plot the data.
After the data is plotted, you can use the cursor movement keys as usual to change the viewing angle.
(Credit to anonymous poster on TI 89/92+ Discussion Group)
[4.12] Random scatter plots of 'noisy' functions
The function plot feature of the TI-89/92+ will plot, at most, one point for each x-axis display pixel. If
the function is rapidly changing, the resulting graph will not accurately represent the function. For
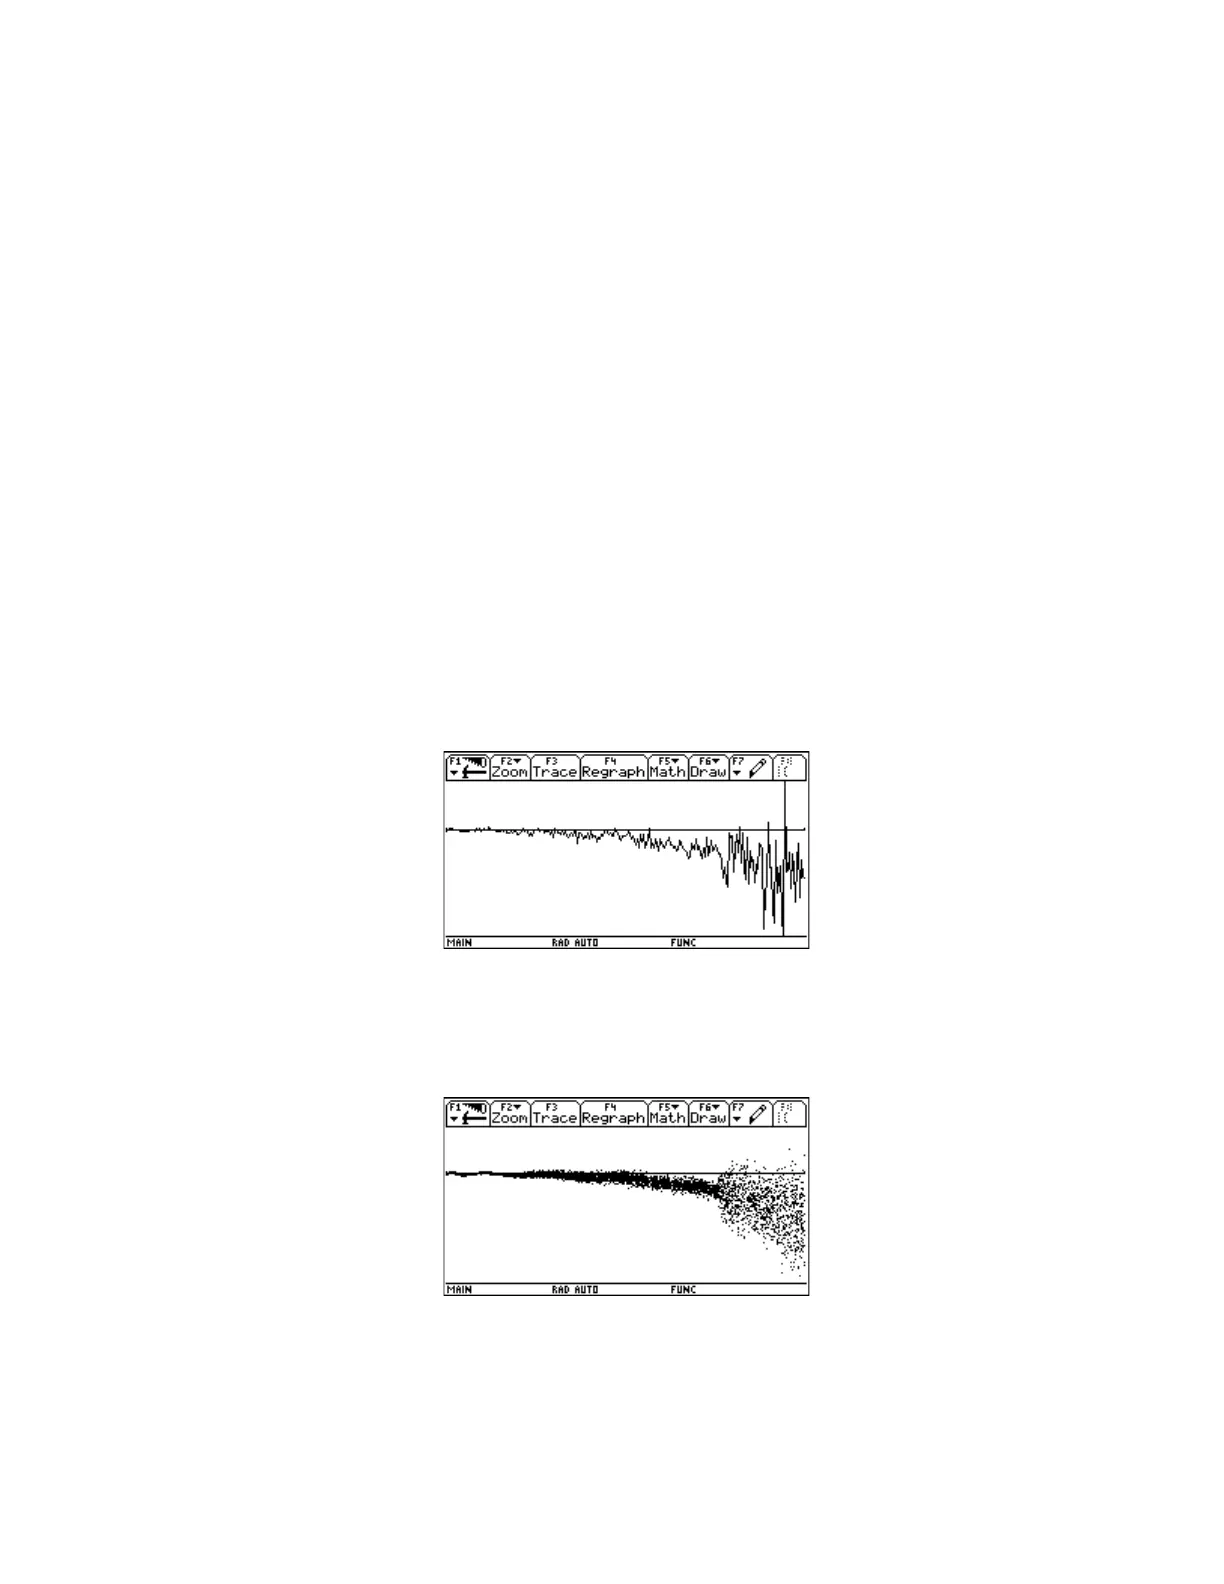
example, the Y= editor was used to make this graph, with a resolution of one:
The graph shows the error for a Chebychev polynomial fit of ln(x) for x=1 to x=2. The y-axis range is
about -2.4E-10 to 1.1E-10. However, if we randomly choose many points on the x-axis and plot the
function at each point, we get a graph that looks like this:
This type of scatter plot gives us more information about the function. Some oscillation is seen at low
values of x, then the error slowly increases up to about x = 1.75. Beyond this point, the error suddenly
increases. This graph shows at 5000 plotted points.
4 - 16

 Loading...


