Using a graphic display calculator
© Oxford University Press 2012: this may be reproduced for class use solely for the purchaser’s institute
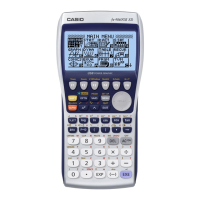
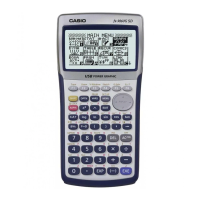
Casio fx-9860GII
Table of contents
Functions
.
Graphing linear functions 2
Finding information about the graph
.
Finding the gradient (slope) of a line 3
.
Solving simultaneous equations
graphically 3
Simultaneous and quadratic equations
.
Solving simultaneous linear equations in
two unknowns 4
.
Solving simultaneous linear equations in
three unknowns 5
Quadratic functions
.
Drawing a quadratic graph 9
.
Solving quadratic equations 10
.
Finding a local minimum or
maximum point 11
Complex numbers
.
Operations with complex numbers 15
.
Conjugate, modulus and argument 16
.
Solving equations with complex roots 16
.
Polar form 17
Exponential functions
.
Drawing an exponential graph 18
.
Finding a horizontal asymptote 19
Logarithmic functions
.
Evaluating logarithms 20
.
Finding an inverse function 21
.
Drawing a logarithmic graph 22
Trigonometric functions
.
Degrees and radians 22
.
Drawing trigonometric graphs 23
More complicated functions
.
Solving a combined quadratic and exponential
equation 24
Sequences and series
.
Summation of a series 25
Modelling
.
Using sinusoidal regression 27
.
Drawing a piecewise function 28
Use this list to help you nd the topic you needInstructions for the Casio fx-9860GIl calculator
Di erential calculus
.
Finding the gradient at a point 28
.
Drawing a tangent to a curve 29
.
Finding maximum and minimum
points 30
.
Finding a numerical derivative 31
.
Graphing a numerical derivative 32
.
Using the second derivative 34
Integral calculus
.
Finding the value of a defi nite integral 35
.
Finding the area under a curve 36
Vectors
Scalar product
.
Calculating a scalar product 37
.
Calculating the angle between two vectors 38
Vector product
.
Calculating a vector product 39
Statistics and probability
Entering data
.
Entering lists of data 39
.
Entering data from a frequency table 40
Drawing charts
.
Drawing a frequency histogram from a list 40
.
Drawing a frequency histogram from
a frequency table 41
.
Drawing a box and whisker diagram
from a list 42
.
Drawing a box and whisker diagram from a
frequency table 42
Calculating statistics
.
Calculating statistics from a list 43
.
Calculating statistics from a frequency table 44
.
Calculating the interquartile range 45
.
Using statistics 45
Calculating binomial probabilities
.
Use of nCr 46
.
Calculating binomial probabilities 47
Calculating Poisson probabilities
.
Calculating poisson probabilities 49
Calculating normal Probabilities
.
Calculating normal probabilities from X-values 52
.
Calculating X-values from normal probabilities 53
Using a graphic display
calculator
CHAPTER OBJECTIVES:
This chapter shows you how to use your graphic display calculator
(GDC) to solve the different types of problems that you will meet in your
course. You should not work through the whole of the chapter – it is simply
here for reference purposes. When you are working on problems in the
mathematical chapters, you can refer to this chapter for extra help with
your GDC if you need it.
1






 Loading...