EasyManua.ls Logo

Casio fx-9860GII User Manual

Casio fx-9860GII
55 pages
To Next Page IconTo Next Page
To Previous Page IconTo Previous Page
Page #21 background imageLoading...
Page #21 background image
Using a graphic display calculator
© Oxford University Press 2012: this may be reproduced for class use solely for the purchaser’s institute
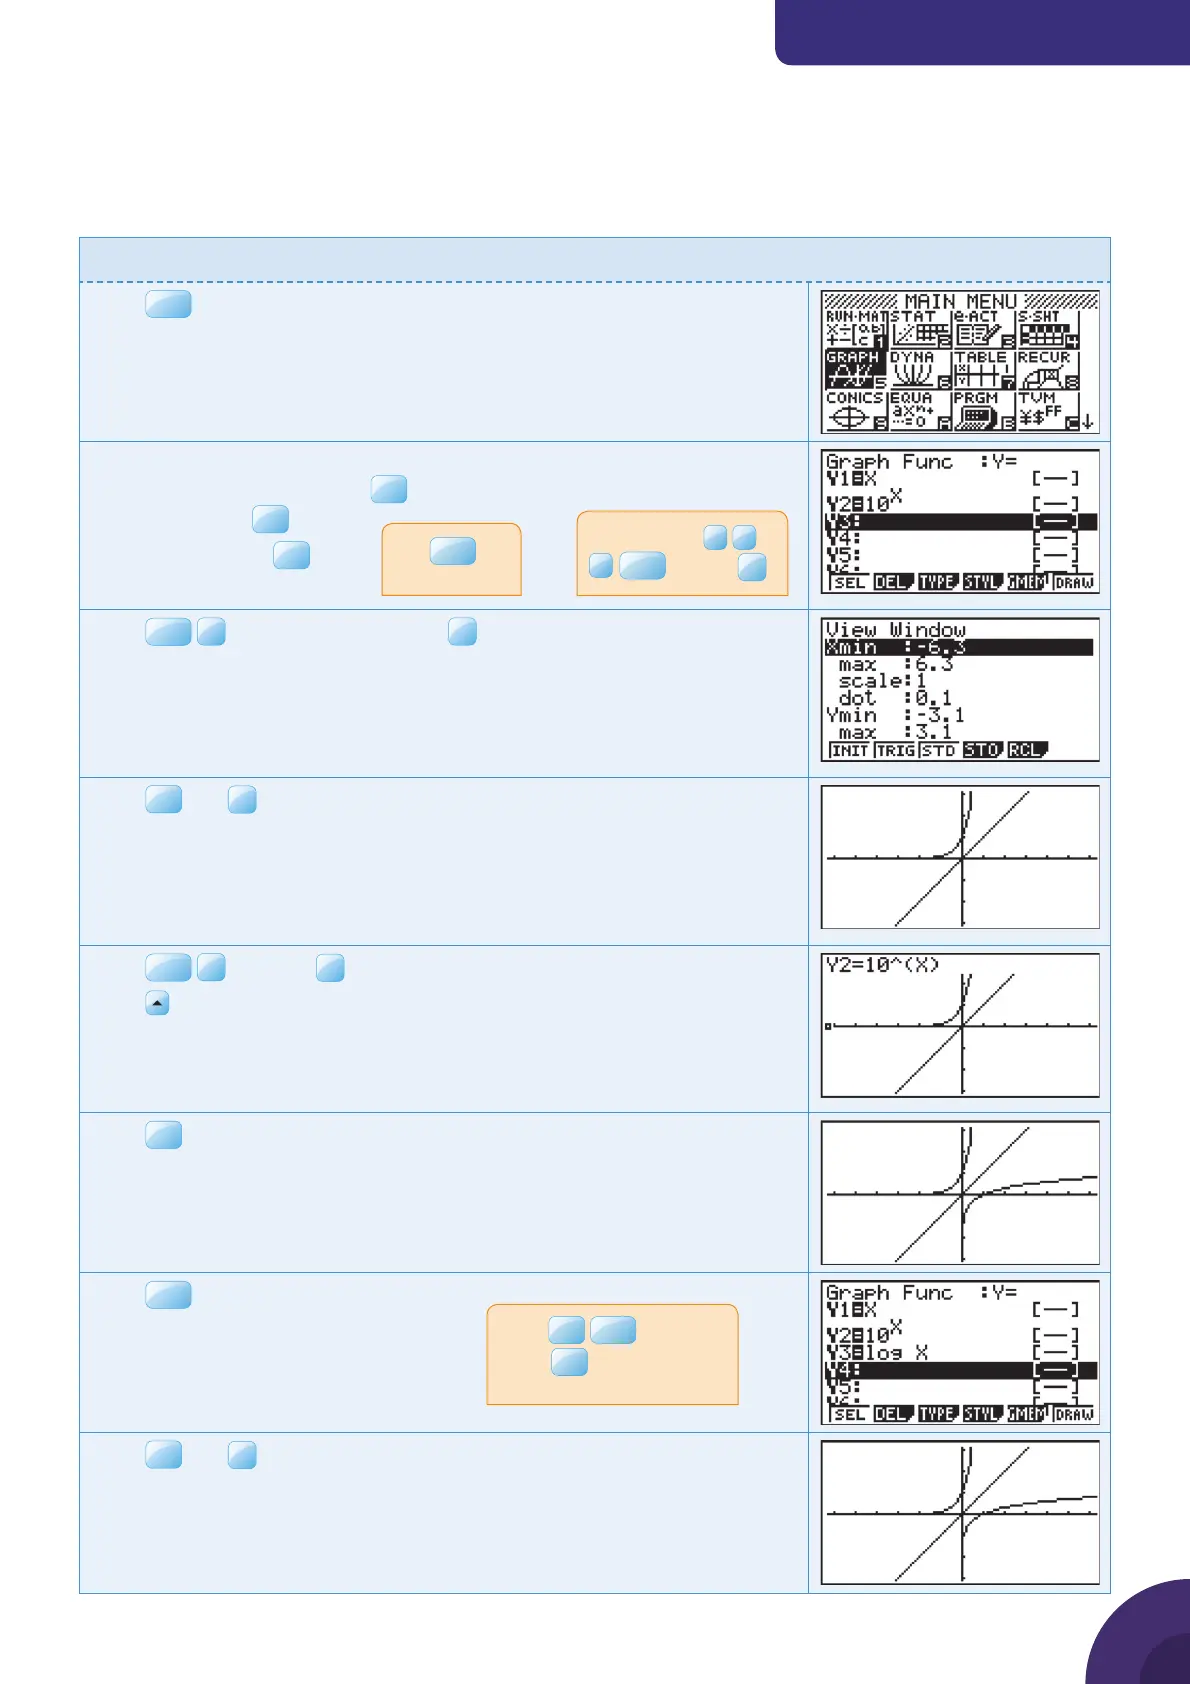
Casio fx-9860GII
1.16 Finding an inverse function
The inverse of a function can be found by interchanging the x and y values.
Geometrically this can be done by refl ecting points in the line y = x.
Example 19
Show that the inverse of the function y = 10
x
is y = log
10
x by refl ecting y = 10
x
in the line y = x.
Press
MENU
. You will see the dialog box as shown on the right.
Draw the line y = x so that it can be recognised as the axis of refl ection.
Choose 5: GRAPH and press
EXE
.
Type x and press
EXE
.
Type 10
x
and press
EXE
.
Press
SHIF T
F3
V-Window and choose
F1
INIT to set up square
axes which are −6.3 ≤ x ≤ 6.3 and −3.1 ≤ y ≤ 3.1.
Press
EXE
and
F6
DRAW.
The graphs of y = x and y = 10
x
are displayed.
Press
SHIF T
F4
Sketch |
F4
Inv.
Press
to select the curve Y2 = 10
x
.
Press
EXE
.
The calculator will display the inverse of the function y = 10
x
.
Press
EXIT
to display the Y= editor.
Type log (x).
Press
EXE
and
F6
DRAW to display the graphs of y = x,
y = 10
x
and y = log
10
x.
The inverse function and the logarithmic function coincide, showing
that y = log
10
x is the inverse of the function y = 10
x
.
Use
X,i,T
to
enter x.
Note: Type 10
1
0
>
X,i,T
to enter
10
x
.
Press
log
X,i,T
to enter
log(x).
log
is a shorter way
to enter log
10
.
21

Table of Contents

Other manuals for Casio fx-9860GII

Question and Answer IconNeed help?

Do you have a question about the Casio fx-9860GII and is the answer not in the manual?

Casio fx-9860GII Specifications

General IconGeneral
TypeGraphing
Form factorDesktop
Control typeButtons
Product colorSilver
Housing materialPlastic
Built-in capabilityYes
Digits- digits
Display typeLCD
Second displayNo
Display tilting-
Display resolution64 x 128 pixels
Display character size8 x 21 mm
Display number of lines8 lines
Display number of characters21
Flash memory1.5 MB
RAM capacity0.064 MB
Storage media typeFlash
Battery typeAAA
Power sourceBattery
Number of batteries supported4

Summary

Functions

1.1 Graphing linear functions

Plotting linear functions on the calculator screen.

1.2 Finding information about the graph

Using the GDC to find graph properties like gradient.

1.3 Solving simultaneous equations graphically

Finding the intersection of graphs to solve simultaneous equations.

1.4 Solving simultaneous linear equations in two unknowns

Using the calculator's equation solver for two linear equations.

1.5 Solving simultaneous linear equations in three unknowns

Solving systems of three linear equations using the GDC.

1.6 Drawing a quadratic graph

Plotting quadratic functions using the GDC's graphing mode.

1.7 Solving quadratic equations

Finding roots of quadratic equations using the calculator.

1.8 Finding a local minimum or maximum point

Finding extrema of functions using tables and built-in functions.

1.9 Operations with complex numbers

Performing arithmetic operations with complex numbers on the GDC.

1.10 Conjugate, modulus and argument

Calculating conjugate, modulus, and argument of complex numbers.

1.11 Solving equations with complex roots

Solving polynomial equations with complex roots using the calculator.

1.12 Polar form

Converting complex numbers between Cartesian and polar forms.

1.13 Drawing an exponential graph

Graphing exponential functions using the GDC.

1.14 Finding a horizontal asymptote

Identifying horizontal asymptotes by analyzing function behavior.

1.15 Evaluating logarithms

Calculating logarithms with different bases using the GDC.

1.16 Finding an inverse function

Finding and graphing inverse functions on the calculator.

1.17 Drawing a logarithmic graph

Plotting logarithmic functions and adjusting the view window.

1.18 Degrees and radians

Switching between degree and radian modes for trigonometric calculations.

1.19 Drawing trigonometric graphs

Graphing trigonometric functions with appropriate axis settings.

1.20 Solving a combined quadratic and exponential equation

Finding intersection points of quadratic and exponential functions.

1.21 Summation of a series

Calculating sums of arithmetic and geometric series.

1.22 Using sinusoidal regression

Fitting a sine curve to data using the GDC's regression function.

1.23 Drawing a piecewise function

Plotting functions defined by multiple conditions or intervals.

Differential calculus

2.1 Finding the gradient at a point

Calculating the instantaneous rate of change (gradient) of a function.

2.2 Drawing a tangent to a curve

Visualizing and finding the equation of a tangent line to a curve.

2.3 Finding maximum and minimum points

Identifying local extrema (maxima and minima) of functions.

2.4 Finding a numerical derivative

Evaluating the derivative of a function at a specific x-value numerically.

2.5 Graphing a numerical derivative

Plotting the gradient function (derivative) of a given function.

2.6 Using the second derivative

Applying the second derivative to determine the nature of stationary points.

Integral calculus

3.1 Finding the value of a definite integral

Calculating definite integrals to find areas or accumulated quantities.

3.2 Finding the area under a curve

Computing the area bounded by a curve and the x-axis using integration.

Vectors

4.1 Calculating a scalar product

Computing the dot product of two vectors using list operations.

4.2 Calculating the angle between two vectors

Finding the angle between two vectors using the dot product formula.

4.3 Calculating a vector product

Note on the GDC's inability to perform cross products of vectors.

Statistics and probability

5.1 Entering lists of data

Inputting numerical data into the calculator's list editor.

5.2 Entering data from a frequency table

Entering data using number-frequency pairs in lists.

5.3 Drawing a frequency histogram from a list

Creating histograms from raw data stored in a list.

5.4 Drawing a frequency histogram from a frequency table

Generating histograms from data entered as frequency tables.

5.5 Drawing a box and whisker diagram from a list

Visualizing data distribution using box plots from list data.

5.6 Drawing a box and whisker diagram from a frequency table

Creating box plots from data entered in a frequency table.

5.7 Calculating statistics from a list

Computing summary statistics (mean, median, etc.) for list data.

5.8 Calculating statistics from a frequency table

Calculating summary statistics for data from a frequency table.

5.9 Calculating the interquartile range

Determining the IQR (Q3 - Q1) from calculated statistics.

5.10 Using statistics

Accessing stored statistical values for further calculations.

5.11 The use of nCr

Calculating combinations (nCr) for probability problems.

5.12 Calculating binomial probabilities

Finding probabilities for binomial distributions using the GDC.

5.13 Calculating Poisson probabilities

Calculating probabilities for Poisson distributions (P.D. and C.D.).

5.14 Calculating normal probabilities from X-values

Finding probabilities for normal distributions given X-values and parameters.

5.15 Calculating X-values from normal probabilities

Finding X-values for normal distributions given probabilities and parameters.

Related product manuals