 Loading...


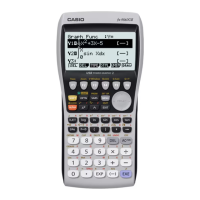
Do you have a question about the Casio fx-9860GII and is the answer not in the manual?
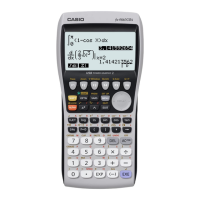
| Type | Graphing |
|---|---|
| Form factor | Desktop |
| Control type | Buttons |
| Product color | Silver |
| Housing material | Plastic |
| Built-in capability | Yes |
| Digits | - digits |
| Display type | LCD |
| Second display | No |
| Display tilting | - |
| Display resolution | 64 x 128 pixels |
| Display character size | 8 x 21 mm |
| Display number of lines | 8 lines |
| Display number of characters | 21 |
| Flash memory | 1.5 MB |
| RAM capacity | 0.064 MB |
| Storage media type | Flash |
| Battery type | AAA |
| Power source | Battery |
| Number of batteries supported | 4 |
