Using a graphic display calculator
© Oxford University Press 2012: this may be reproduced for class use solely for the purchaser’s institute
Casio fx-9860GII
Modelling
1.22 Using sinusoidal regression
The
notation sin
2
x, cos
2
x, tan
2
x, … is a mathematical convention that has little algebraic
meaning. To enter these functions on the GDC, you
should
enter (sin(x))
2
, etc. However, the
calculator will conveniently interpret sin(x)
2
as (sin(x))
2
.
Example 27
It is known that the following data can be modelled using a sine curve.
x
01234567
y
6.9 9.4 7.9 6.7 9.2 8.3 6.5 8.9
Use sine regression to fi nd a function to model this data.
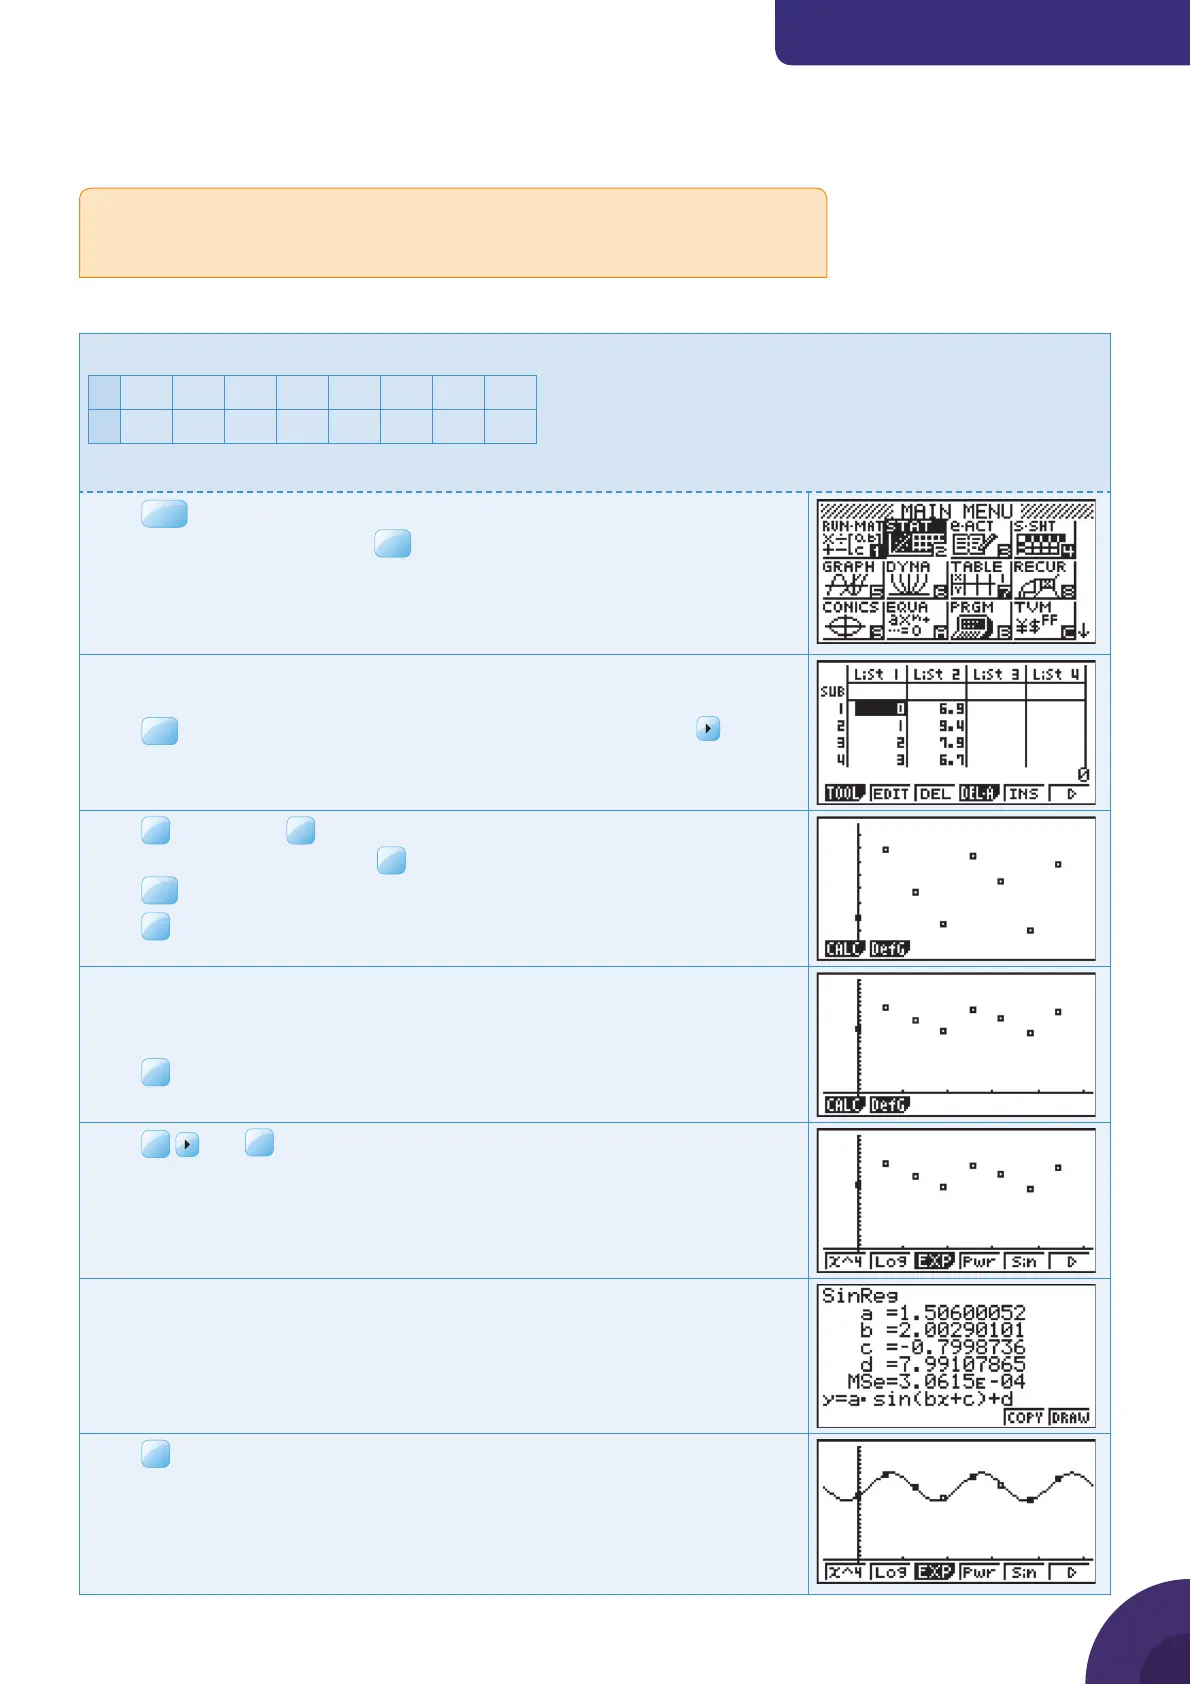
Press
MENU
. You will see the dialog box as shown on the right.
Choose the 2: STAT and press
Type the x-values in the fi rst column (List 1) and the y-values in the
second column (List 2).
Press
EXE
after each number to move down to the next cell. Press
to move to the next column.
You can use columns from List 1 to List 26 to enter the lists.
Press
F1
GRPH and
F6
SET.
Select Graph Type and choose
F1
Scatter.
Press
EXE
.
Press
The automatic scales do not always give the best display of the box and
scatter diagram. You cannot use V-Window to change the default values,
but you can zoom in or out.
Press
Press
F6
and
F5
Sin.
On screen, you will see the result of the sinusoidal regression.
The equation is in the form y = asin(bx + c) + d and you will see the values
of a, b, c and d displayed separately.
The equation of the sinusoidal regression line is
y = 1.51sin(2.00x − 0.80) + 7.99
Press
F6
DRAW to return to the Graphs page.
27