Using a graphic display calculator
© Oxford University Press 2012: this may be reproduced for class use solely for the purchaser’s institute
Casio fx-9860GII
1.23 Drawing a piecewise function
Example 28
Draw the function
2
1
2
4+3, 3
()
(3), 3
xxx
fx
xx
t
ì
ï
ï
ï
í
ï
ï
ï
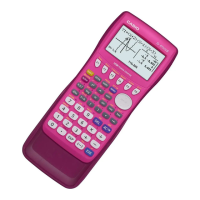
Press
MENU
. You will see the dialog box as shown on the right.
Choose 5: GRAPH and press
The default graph type is Function, so the form Y= is displayed.
Type x
2
− 4x + 3, [−10, 3] in Y1 and press
EXE
.
Type
1
2
( 3)[3, 10]x −
in Y2 and press
Press
F6
DRAW
Choose suitable axes to display the curves.
The piecewise function is displayed.
2 2 Di erential calculus
2.1 Finding the gradient at a point
Example 29
Find the gradient of the cubic function y = x
3
− 2x
2
− 6x + 5 at the point where x = 1.5.
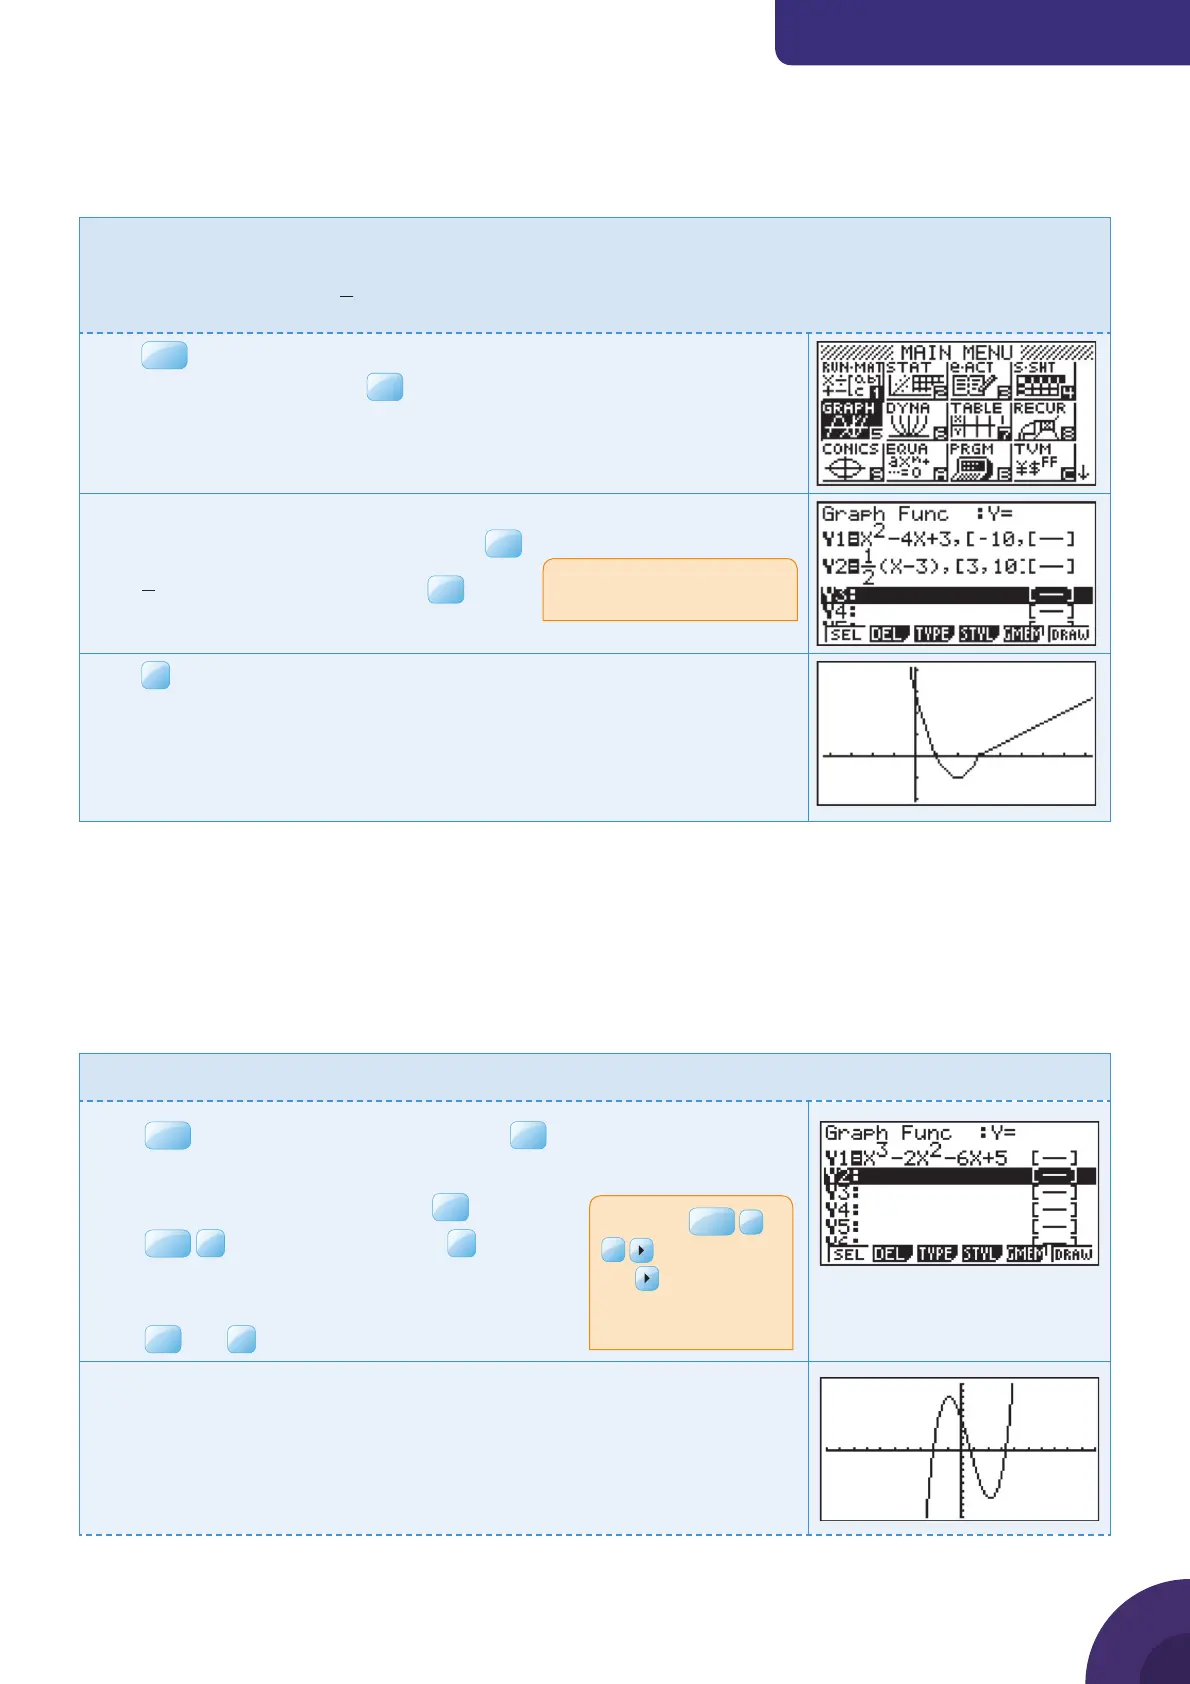
Press
MENU
and choose 5: GRAPH and press
EXE
.
The default graph type is Function, so the form Y= is displayed.
Type y = x
3
− 2x
2
− 6x + 5 and press
EXE
.
Press
SHIF T
F3
V-Window and choose
F3
STD
to use the default axes which are −10 ≤ x ≤ 10
and −10 ≤ y ≤ 10.
Press
EXE
and
F6
DRAW.
The calculator displays the curve with the default axes.
Use square brackets to enter
the domains.
Note: Type
X,i,T
>
3
to enter x
3
.
The
returns you to
the baseline from the
exponent.
{ Continued on next page
28

 Loading...