Using a graphic display calculator
© Oxford University Press 2012: this may be reproduced for class use solely for the purchaser’s institute
Casio fx-9860GII
Finding information about the graph
The GDC can give you a lot of information about the graph of a function,
such as the coordinates of points of interest and the gradient (slope).
1.2 Finding the gradient (slope) of a line
The correct mathematical notation for gradient (slope) is
d
y
x
. You will fi nd
out more about this in the chapter on differential calculus. Here we just need
to know this is the notation that will give us the gradient (slope) of the line.
Example 2
Find the gradient of y = 2x + 1.
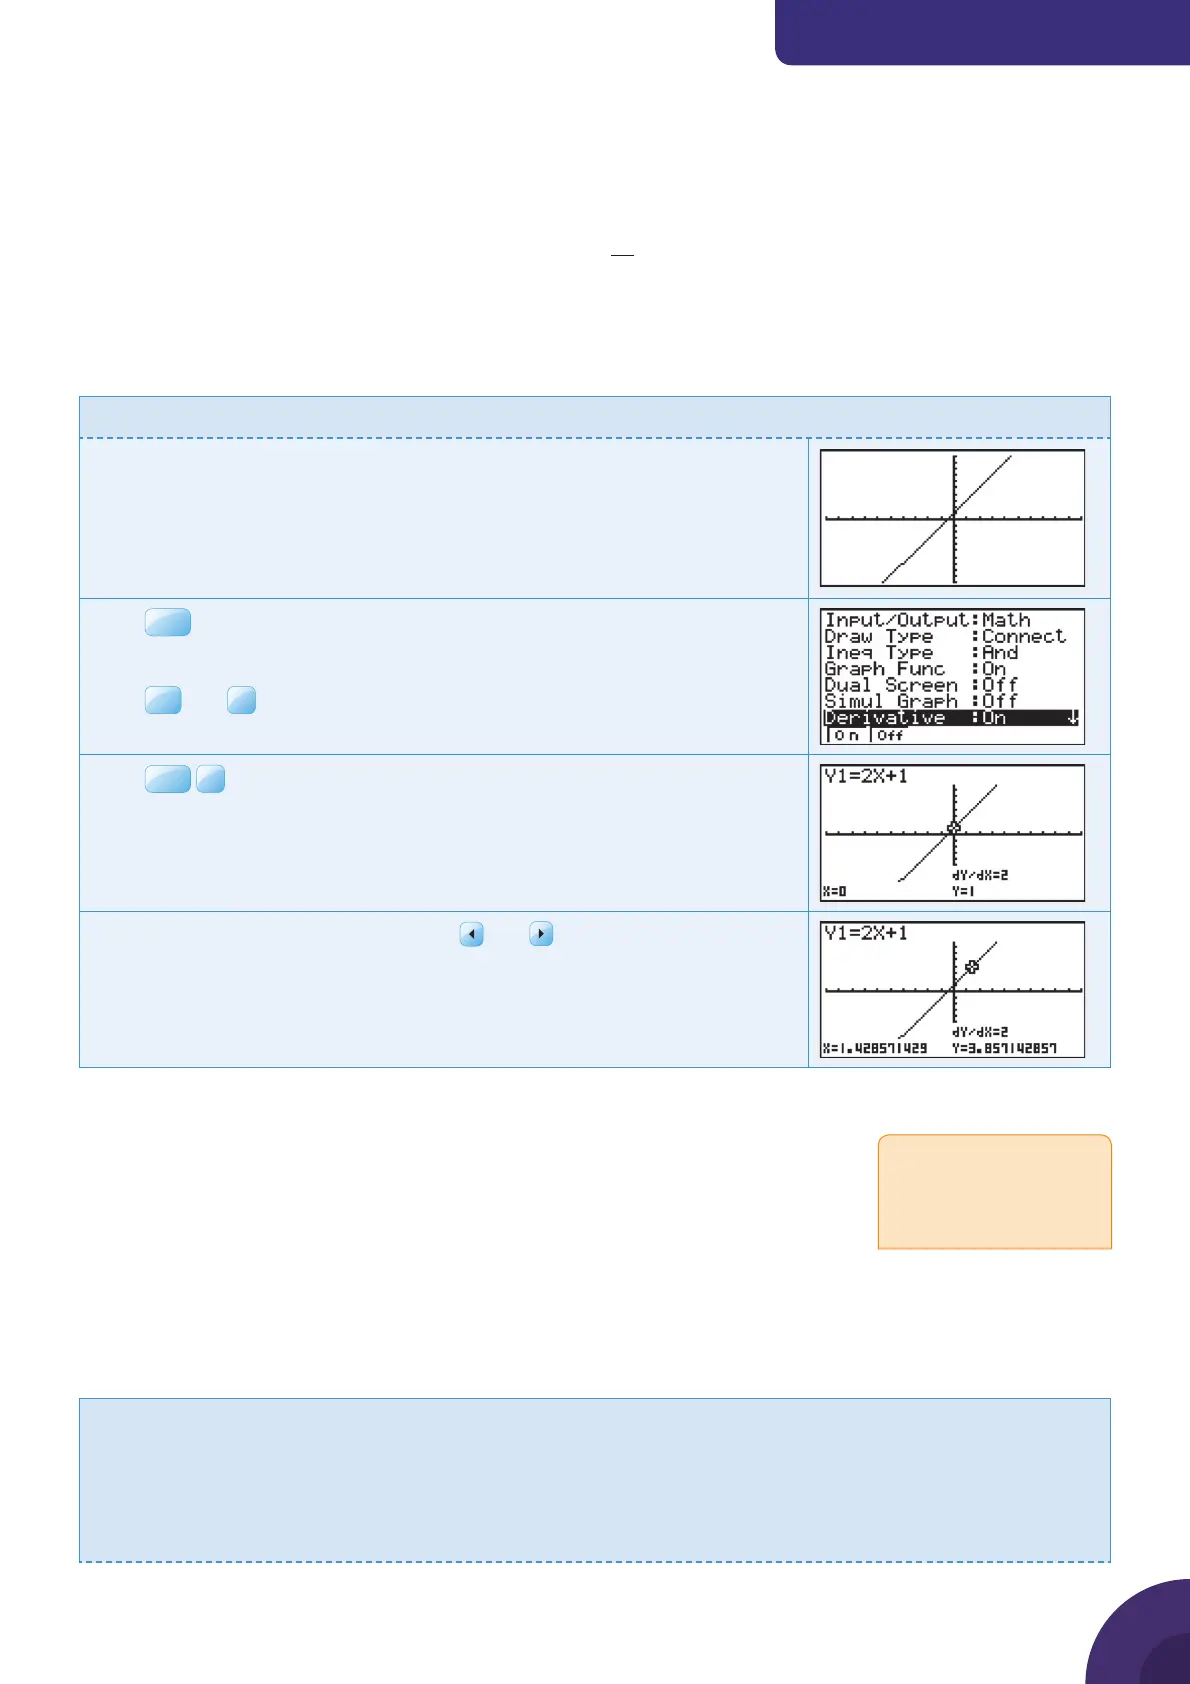
First draw the graph of y = 2x + 1 as in Example 1.
Press
SHIF T
(SET UP).
Set Derivative to On.
Press
EXE
and
F6
DRAW to return to the graph.
Press
SHIF T
F1
Trace.
The calculator displays the coordinates of the point and the gradient.
Move the point along the line using the and
keys.
The gradient (slope) is shown by dy/dx and is 2 at every point along
the line.
1.3 Solving simultaneous equations graphically
To solve simultaneous equations graphically you draw the straight lines and then
fi nd their point of intersection. The coordinates of the point of intersection give
you the solutions x and y.
Note:
The calculator will only draw the graphs of functions that are expressed
explicitly. By that we mean functions that begin with ‘y =’ and have a function that
involves only x to the right of the equals sign. If the equations are written in a different
form, you will need to rearrange them before using your calculator to solve them.
Example 3
Solve the simultaneous equations 2x + y = 10 and x − y = 2 graphically with your GDC.
First rearrange both equations in the form y =
2x − y = 10 x − y = 2
y = 10 − 2x −y = 2 − x
y = x − 2
Solving simultaneous
equations using a
non-graphical method is
covered in section 1.5.
{ Continued on next page
3