EasyManuals Logo
Home>Casio>Calculator>fx-9860GII

Casio fx-9860GII User Manual

Casio fx-9860GII
55 pages
To Next Page IconTo Next Page
To Previous Page IconTo Previous Page
Page #12 background imageLoading...
Page #12 background image
Using a graphic display calculator
© Oxford University Press 2012: this may be reproduced for class use solely for the purchaser’s institute
Casio fx-9860GII
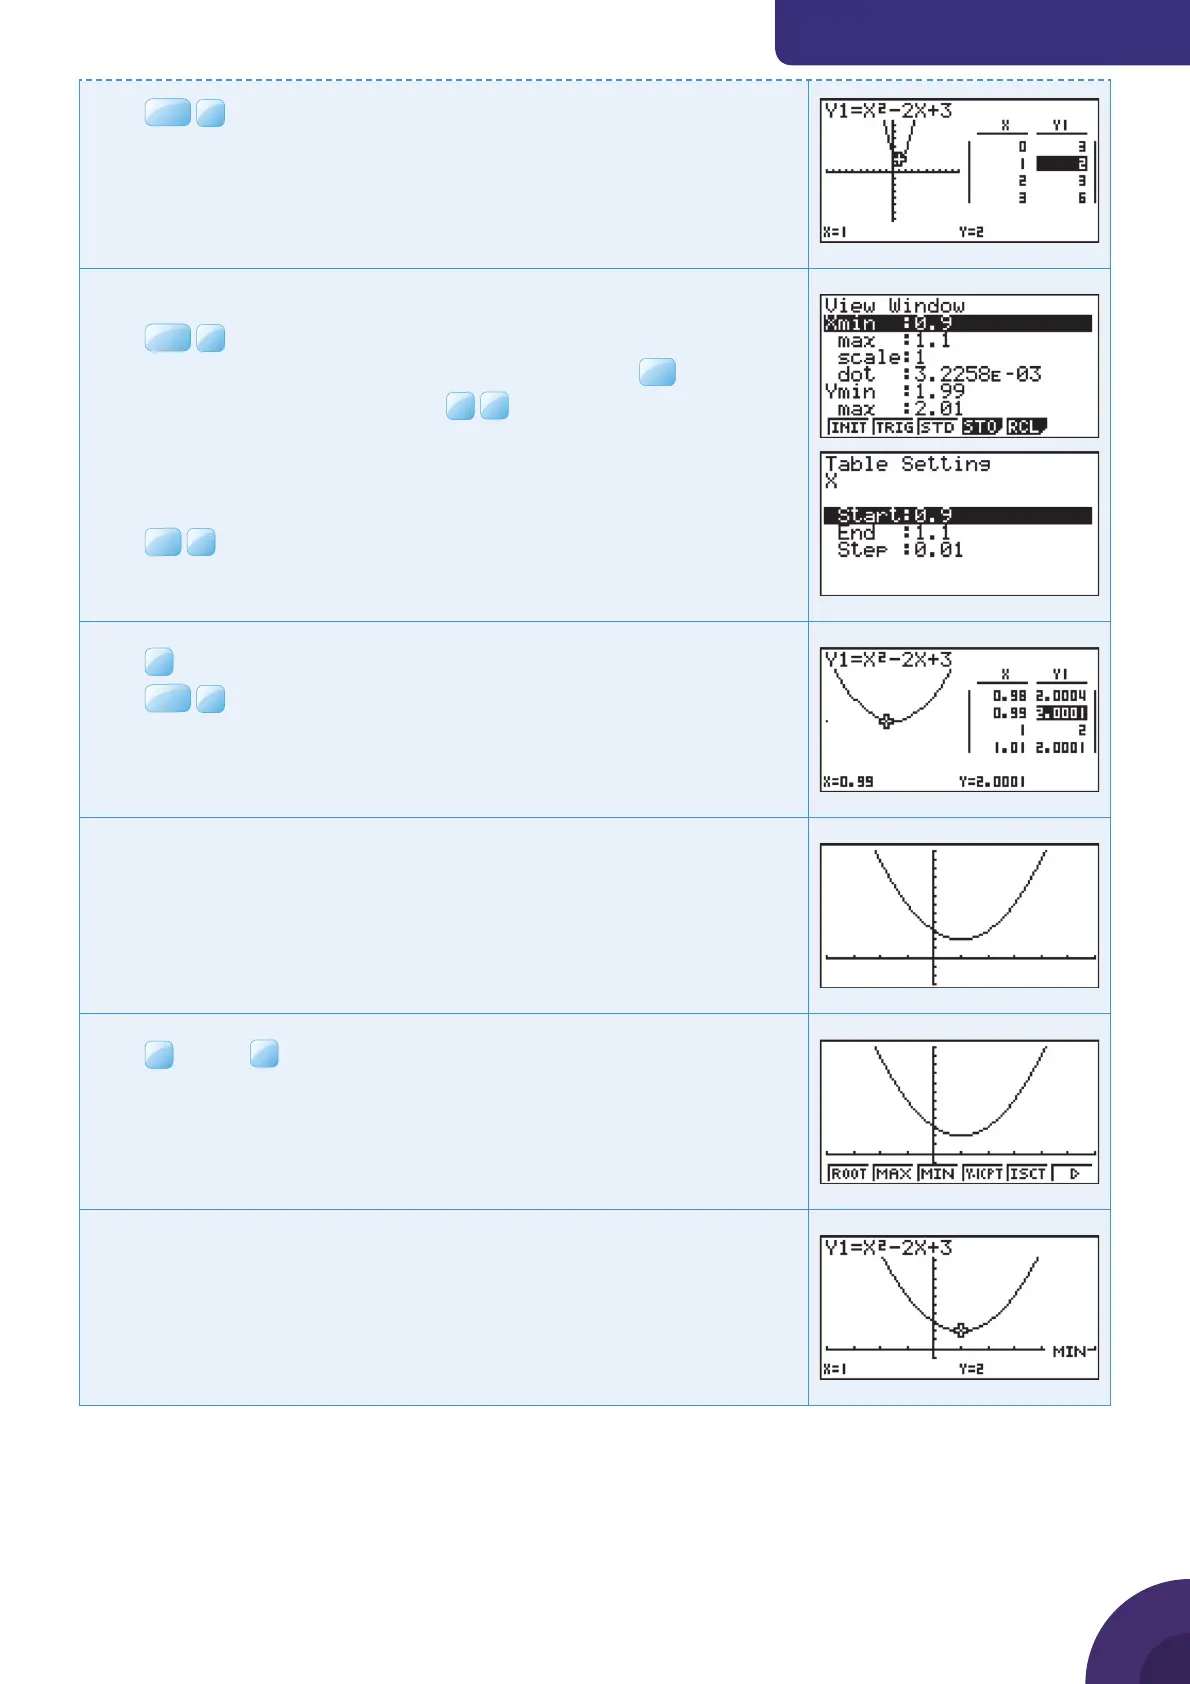
Press
OPTN
F2
GLINK.
When you scroll through the table the cross moves along the curve.
The minimum value shown in the table is 2 when x = 1.
Look more closely at the values of the function around x = 1.
Press
SHIF T
F3
V-Window.
Choose values −0.9 x 1.1 and 1.99 y 2.01 and press
EXE
.
Change the settings in the table: Press
F1
F5
SET.
Set Start to 0.9
End to 1.1
 to 0.01
Press
EXE
F6
to view the graph and the table.
Press
F5
G·CON to display the graph alongside the table.
Press
OPTN
F2
GLINK and scroll through the table.
The table shows that the function has larger values at points around (1, 2).
We can conclude that this is a local minimum on the curve.
Method  – Using the minimum function
Press
F5
G-Solv
F3
MIN.
The calculator displays the minimum point on the curve at (1, 2).
12

Table of Contents

Other manuals for Casio fx-9860GII

Questions and Answers:

Question and Answer IconNeed help?

Do you have a question about the Casio fx-9860GII and is the answer not in the manual?

Casio fx-9860GII Specifications

General IconGeneral
TypeGraphing
Form factorDesktop
Control typeButtons
Product colorSilver
Housing materialPlastic
Built-in capabilityYes
Digits- digits
Display typeLCD
Second displayNo
Display tilting-
Display resolution64 x 128 pixels
Display character size8 x 21 mm
Display number of lines8 lines
Display number of characters21
Flash memory1.5 MB
RAM capacity0.064 MB
Storage media typeFlash
Battery typeAAA
Power sourceBattery
Number of batteries supported4

Related product manuals