4. HOW TO CONTROL CHART OBJECTS
4-2
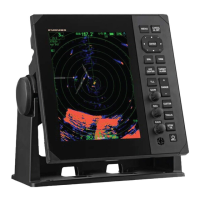
MULTI-COLOR presentation
In the multi-color presentation four colors are used for depths. If the value entered as
the safety contour does not exist in the electronic chart, the system automatically se-
lects the next available deeper depth contour as the safety contour. For example, the
input value is 8 m, but there is no 8 m depth contour in the electronic chart. Then, the
system automatically selects the next available deeper depth contour (10 m) as the
safety contour. The depth contour value of 10 m is used as the safety contour in the
electronic chart.
The shallow contour shows visual color change inside an unsafe water area. An un-
safe water area is all areas shallower than the "safety contour". Set the value for the
shallow contour less than the value of the safety contour.
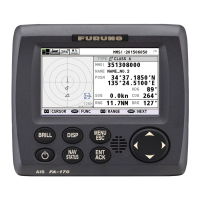
TWO-COLOR presentation
In the two-color presentation, unsafe water is shown in blue and safe water is shown
in white. The safety contour is used to qualify unsafe water (depth shallower than safe-
ty contour) and safe water (depths deeper than safety contour).
If the value entered as the safety contour does not exist in the electronic chart, the sys-
tem automatically selects the next deeper available depth contour as the safety con-
tour, the same as with the multi-color presentation.
Chart zero
Shallow contour
Safety contour (input value)
Safety contour (exisiting in ENC)
Deep contour
Non-navigable area
Navigable area
Non-navigable area
Chart zero
Shallow contour
Safety contour (input value)
Deep contour
Safety contour (exisiting in ENC)
Navigable area
 Loading...