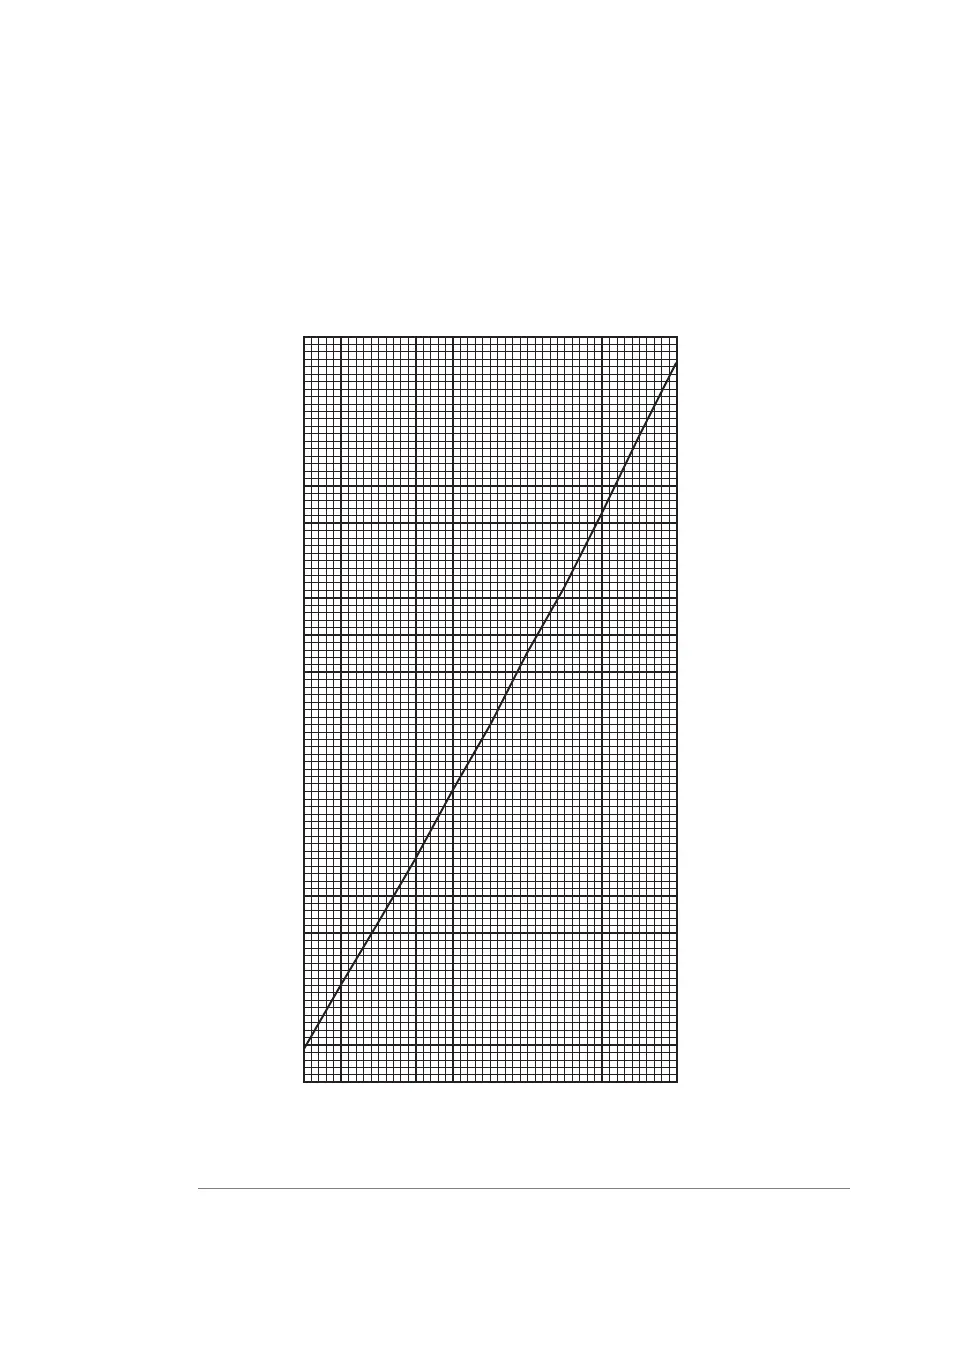
Graph for conductivity value
The graph below shows the conductivity value at the current temperature when 1.00 M
NaCl calibration solution is used.
035202
77
80
85
90
95
97
Temperature (°C)
Conductivity (mS/cm)
Conductivity of 1.00 M NaCl at 20–30°C
330 ÄKTA avant User Manual 29035184 AE
7 Maintenance
7.7 Calibration procedures
7.7.3 Calibrate the Conductivity Monitor
 Loading...