56
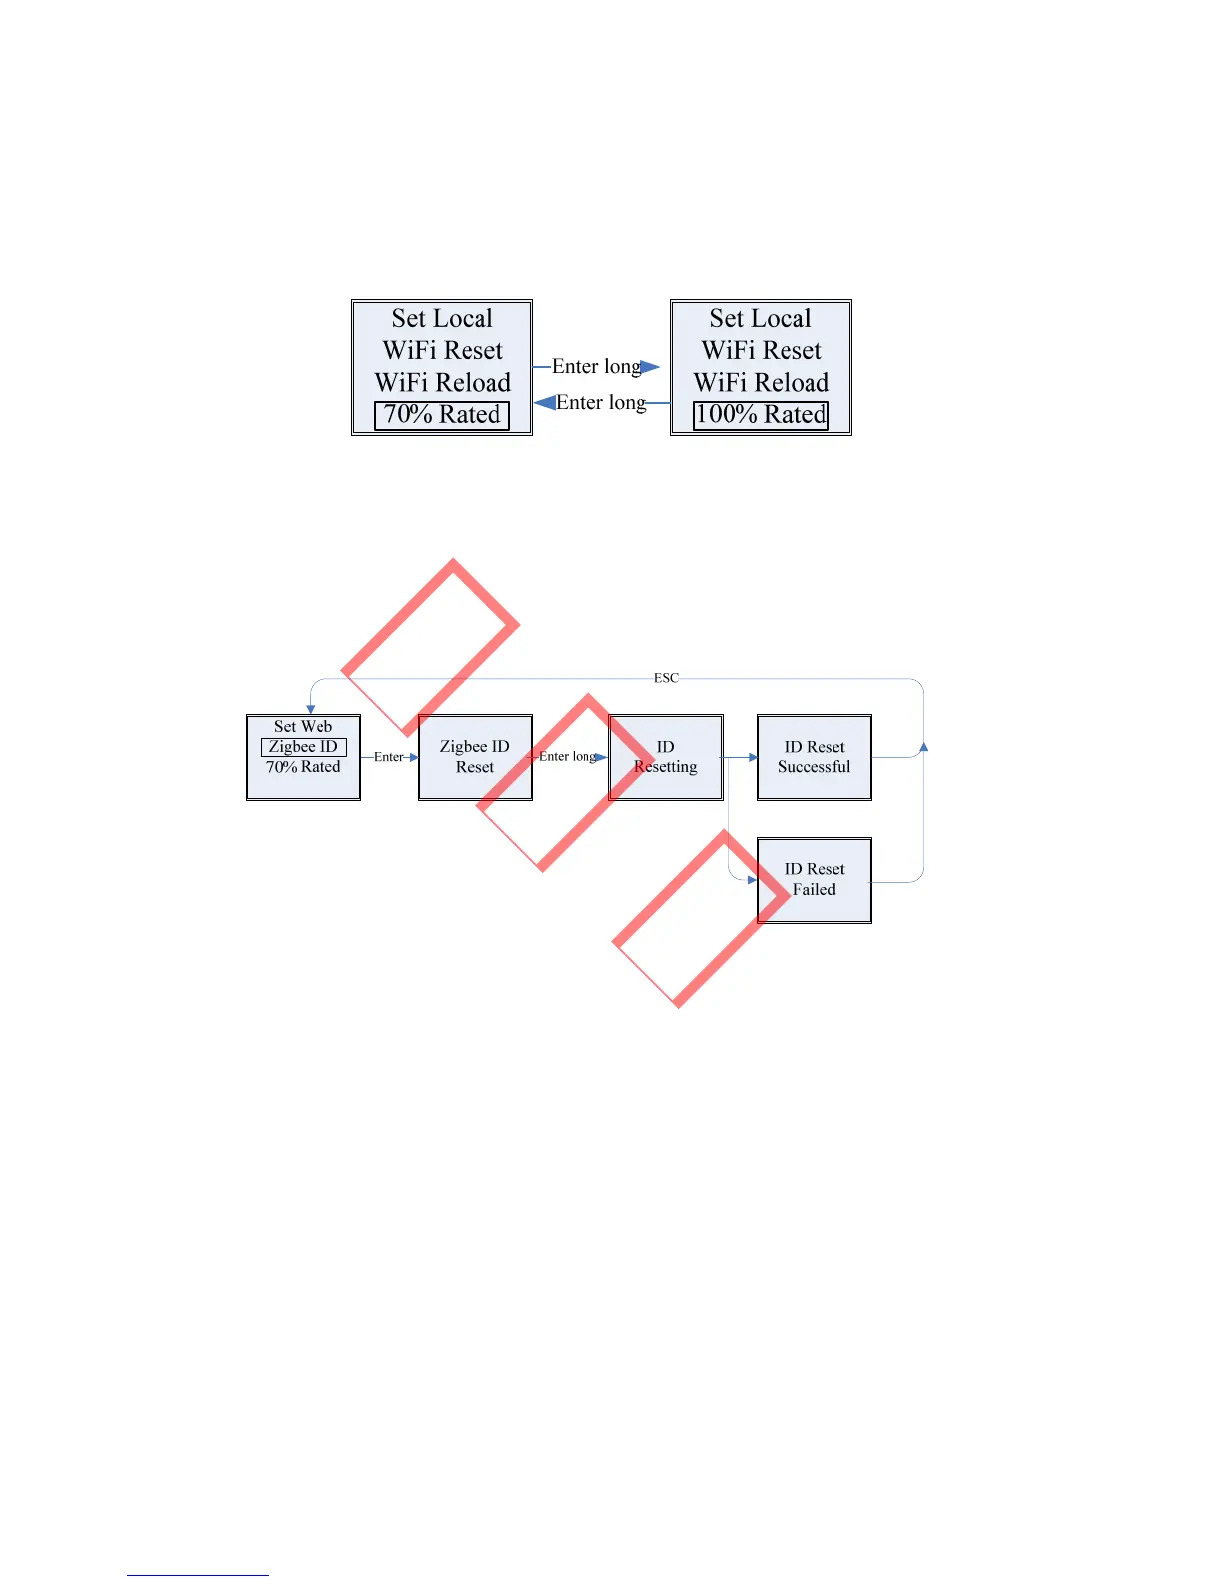
Itemsofthelevel2,level3,regardingforset70%ratedload,arelistedand
shownintheFigure4.2.2‐10
Figure4.2.2‐10
Itemsofthelevel2,level3,regardingforset70%ratedload,arelistedand
shownintheFigure4.2.2‐9
Figure4.2.2‐11
4.2.3 RightMiddleArea—HistogramDisplay
Thisareausehistogramtodemonstratetheaveragepowergenera tionat
each hour from 4:00am to 8:00pm on one day. Each columnar points 20
scale,thelefttopareashowsthemaximumratedpowergenerationeach
hourforinverter.
This area can display information in different modes, such as power
generation in re
cent 10 years; daily power generation of recent year,
 Loading...