46
USING THE MEMORY FUNCTION
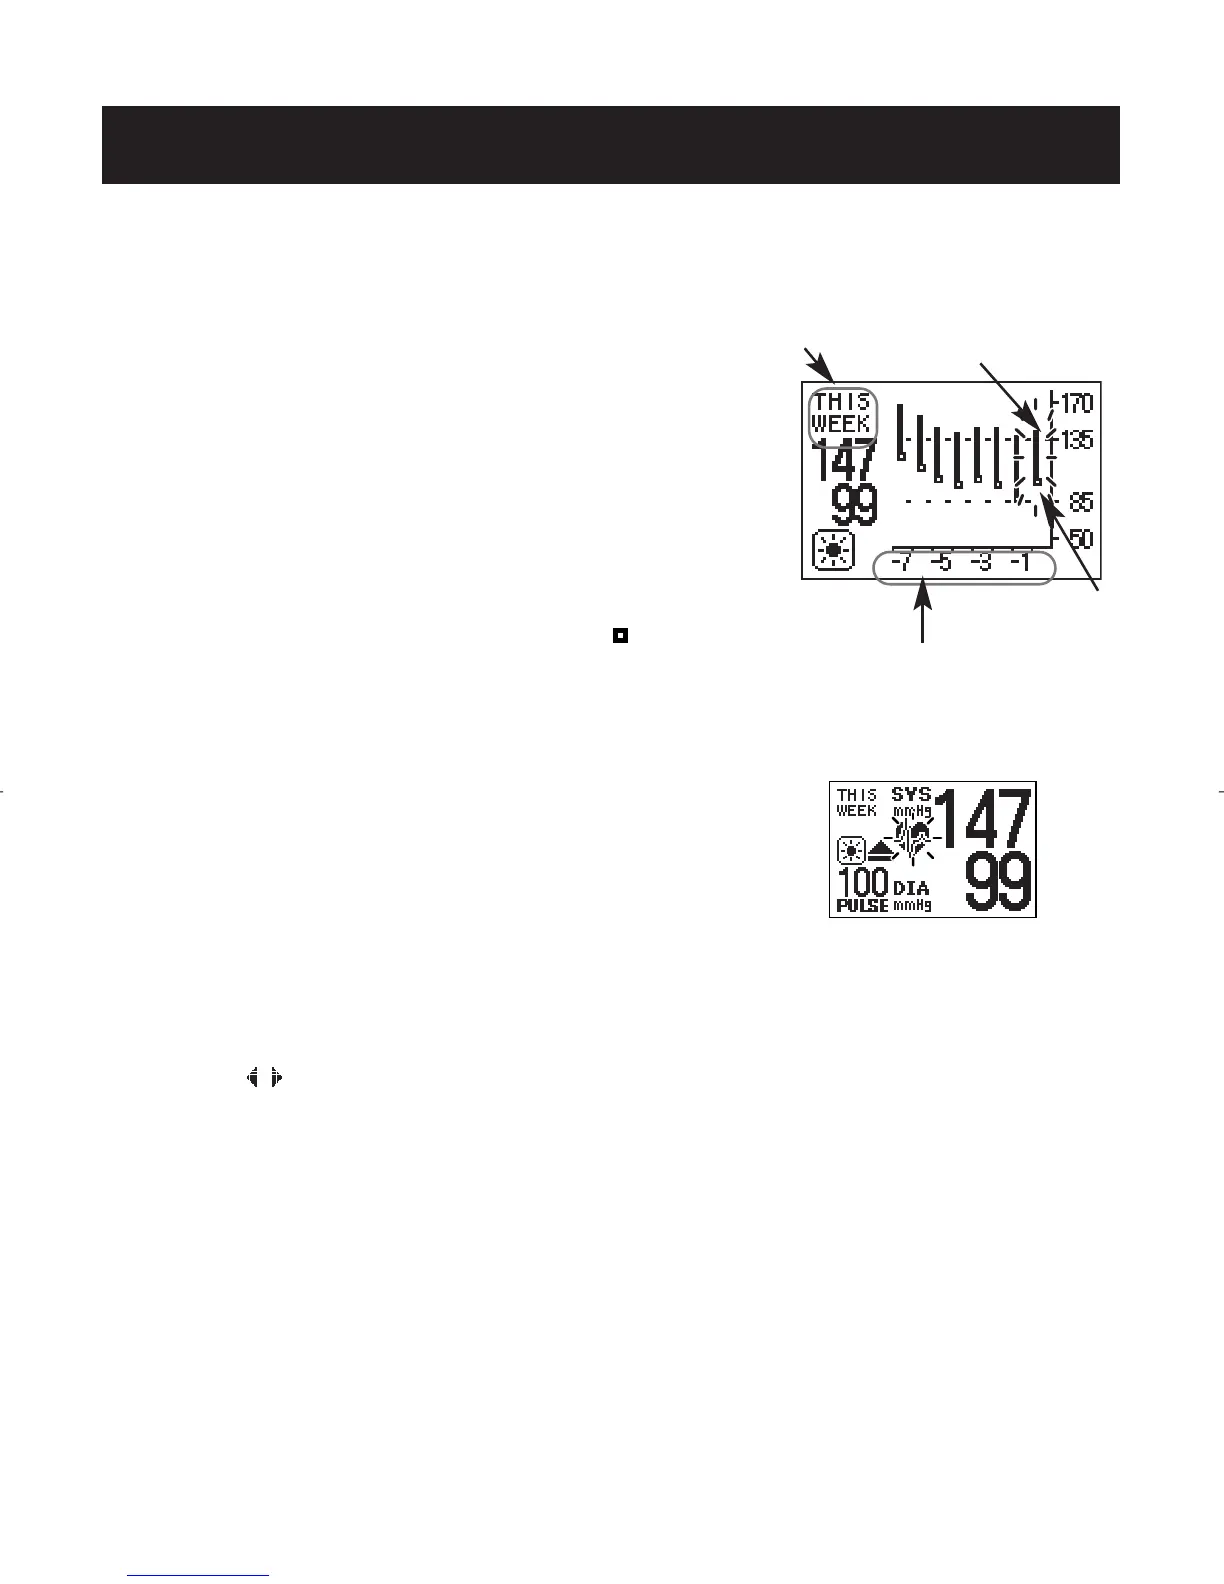
INTERPRETING THE GRAPH
The example used is the Morning Data graph.
When you press the MORNING/EVENING
AVERAGE button, the this week measurement
values flash on the display.
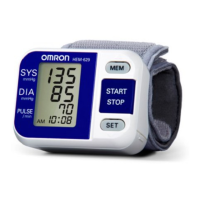
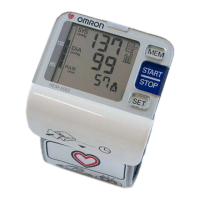
In the illustration shown, the measurement was
taken on this week. The top of the vertical bars
display the systolic blood pressure of 147 mmHg.
The bottom of the vertical bar displays the
diastolic pressure of 99 mmHg. The ( ) box displays
the pulse rate of 100 beats per minute.
TO VIEW THE DATA FLASHING ON
THE DISPLAY
Press the SET button during the Graph display
to view the measurement values for the data
flashing on the screen.
Press the ( ) button to view later or more recent weekly averages.
Press the MORNING/EVENING AVERAGE button to return to the
GRAPH display.
Measurement values for
data flashing on screen
Week
Weeks
Pulse Rate
Blood Pressure Values
(systolic/diastolic)
(mmHg)
 Loading...