Measuring Waveforms
TDS 500D, TDS 600B, & TDS 700D User Manual
3–145
To measure the time of a waveform, repeat the process just described, but count
the horizontal divisions and multiply by the horizontal scale factor. For example,
if you count five major horizontal graticule divisions for one waveform cycle at a
horizontal scale factor of 50 mS/division, then you can easily calculate the
waveform period as:
5 divisions × 50 mS/division = 250 ms, or 4 kHz.
Displaying Histograms (TDS 500D and TDS 700D Models Only)
The TDS Oscilloscope can display histograms constructed from the selected
trace waveform data. You can display either a vertical or horizontal histogram.
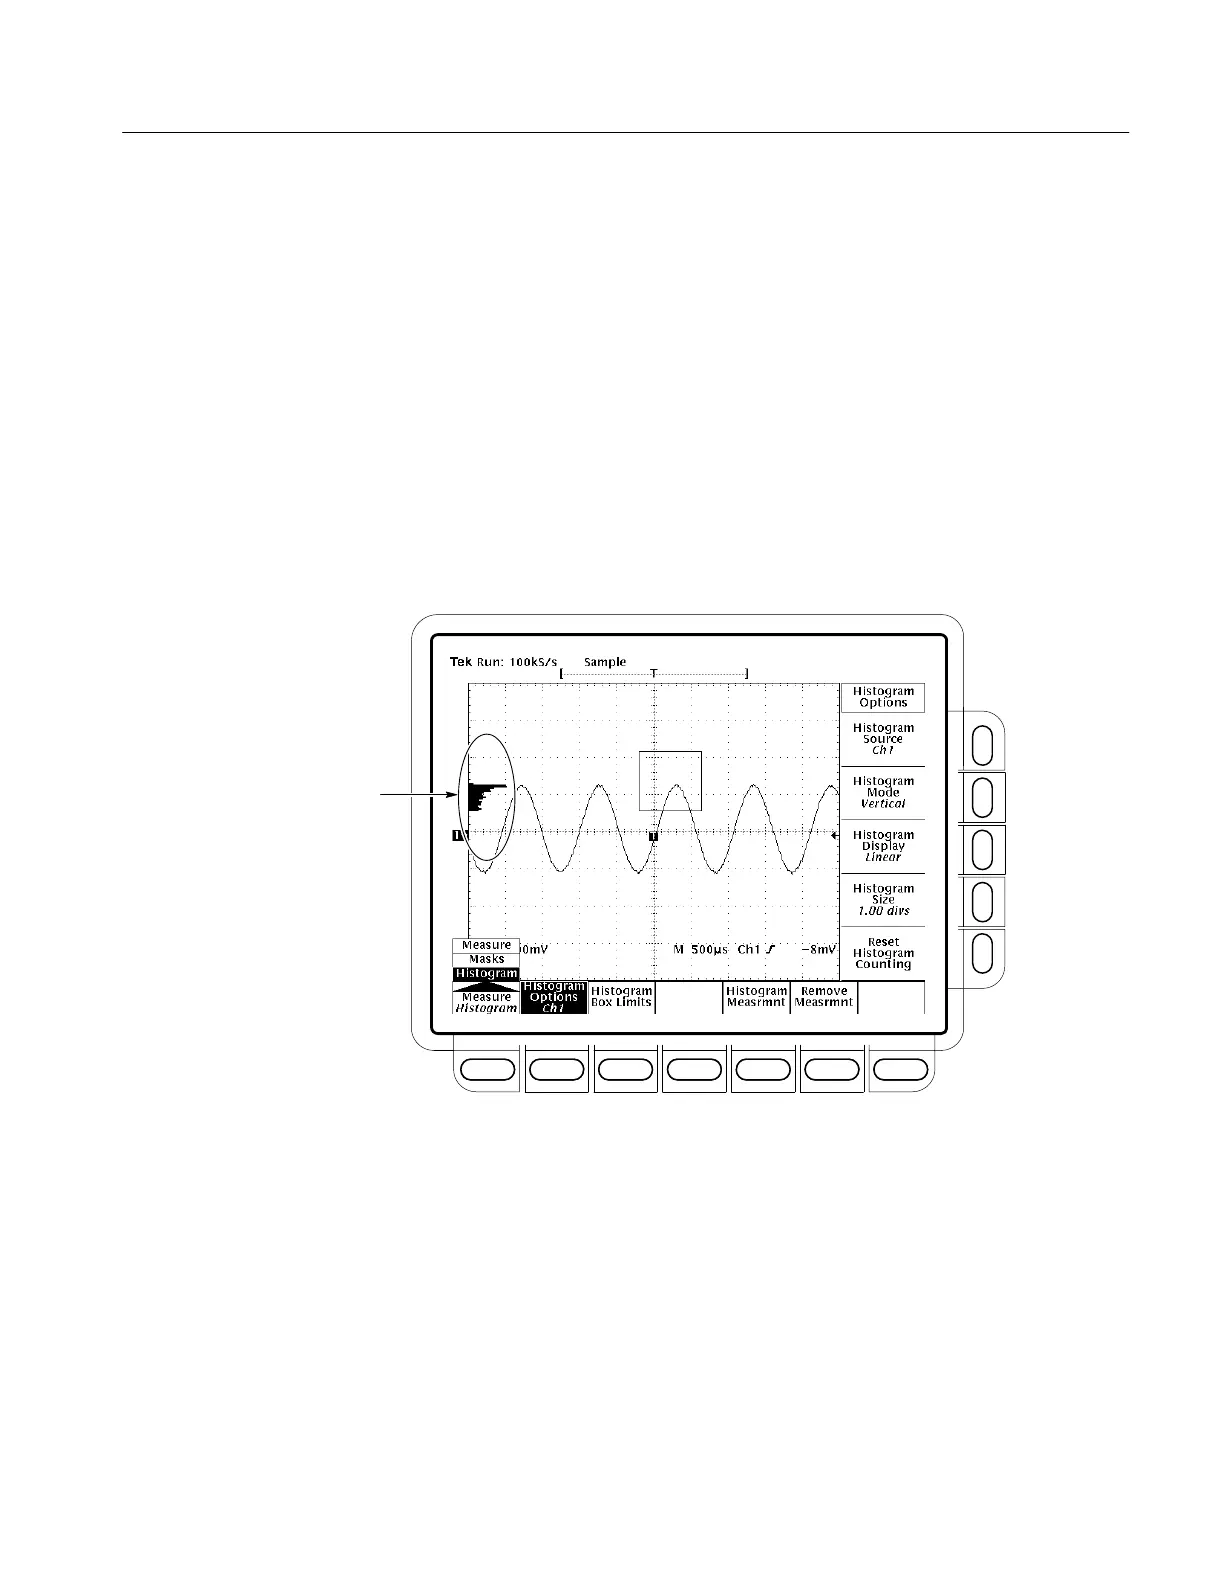
You can display only one type of histogram at a time. See Figure 3–69.
Vertical histogram
Figure 3–69: Histogram Menu and Vertical Histogram
To start histogram counting press MEASURE ➞ Histogram (pop-up) ➞
Histogram Options (main) ➞ Histogram Mode (side) ➞ Off, Vertical, or
Horizontal (side). If you use histogram counting with DPO, see To Set the
Accumulation Depth on page 3–64 for additional information.
Off turns off histogram counting and display.
Measure Waveform Time
Start Histogram Counting
 Loading...