34
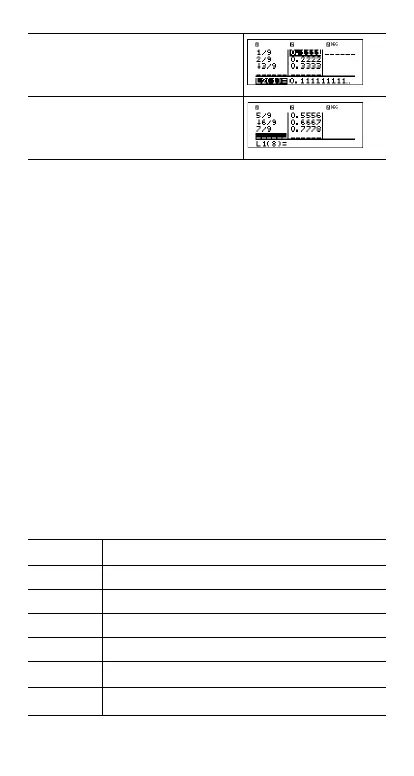
The pattern appears to show that the decimal representation
is a repetition of the number in the numerator for ninths.
Entering , , and finally validates that statement.
Notice the last digit in the list is rounded, so 0.777777… is
shown rounded to 0.77778.
Statistics
%t v
%t displays a menu with the following options:
• 1-Var Stats analyzes data from 1 data set with 1 measured
variable, x.
• 2-Var Stats analyzes paired data from 2 data sets with 2
measured variables—x, the independent variable, and y,
the dependent variable.
• StatVars displays a secondary menu of statistical
variables. The StatVars menu only appears after you have
calculated 1-Var or 2-Var stats. Use $ and # to locate
the desired variable, and press < to select it.
<
Input the rest of the fractions to test
your pattern. Notice L2 updates as
you enter in L1.
Variables Definition
n Number of x or (x,y) data points.
Ï or Ð Mean of all x or y values.
Sx or Sy Sample standard deviation of x or y.
Îx or Îy Population standard deviation of x or y.
x or y
Sum of all x or y values.
x
2
or y
2
Sum of all x
2
or y
2
values.
4
9
---
5
9
---
6
9
---
7
9
---
ΣΣ
ΣΣ
 Loading...