• To graph an equation for a circle, press b > Graph Entry/Edit >
Equation > Circle >
(x-h)
2
+ (y-k)
2
= r
2
or press
b 3 2 3 1. Fill in the equation and press ·
to draw the circle.
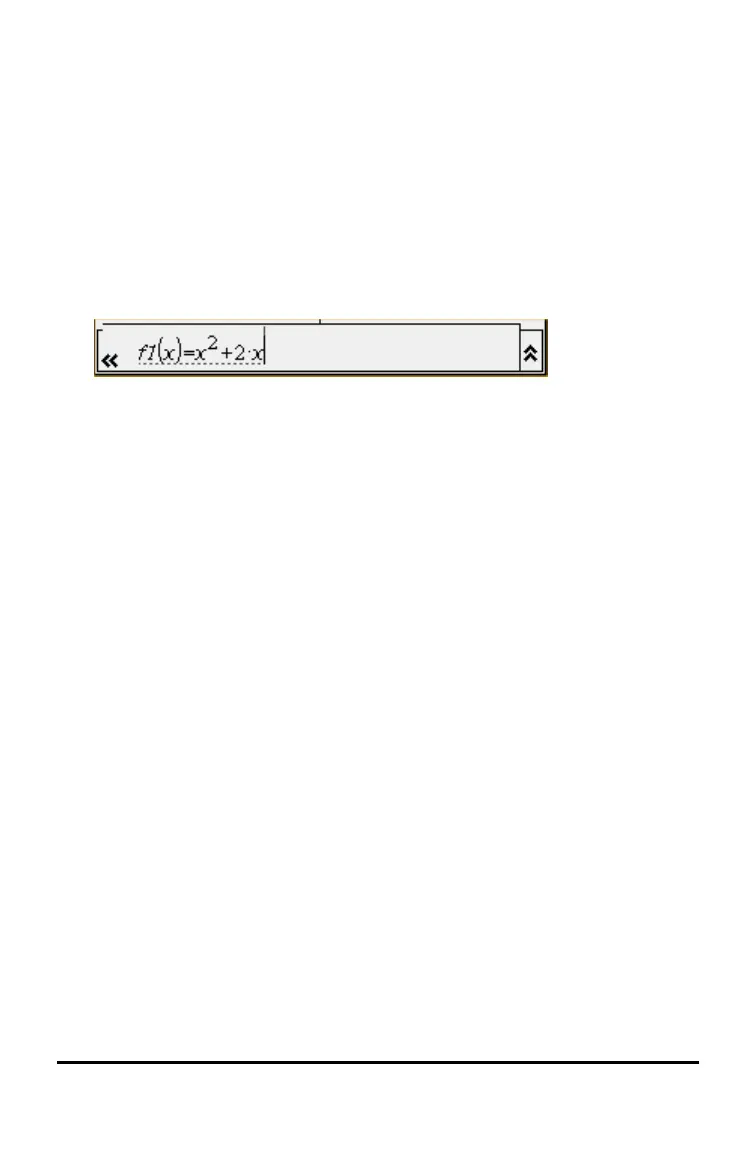
• To graph a function, press b > Graph Entry/Edit > Function or
press b 3 1.
The entry line changes to display the expression format for the specified
graph type. You can specify multiple relations of each graph type.
3. Type an expression and any other parameters required for the graph type.
4. Press · to graph the relation, or press ¤ to add another relation. If
necessary, use press b 4 to choose a tool on the Window/Zoom
menu and adjust the viewing area.
When you graph the relation, the entry line disappears to show an
uncluttered view of the graph. If you select or trace a plot, the relation that
defines the plot is displayed on the entry line. You can modify a plot by
defining a relation or by selecting and changing the graph.
As you graph multiple plots, the defining relation is displayed for each. You
can define and graph a maximum of 99 relations of each type.
5. Use the b key to explore and analyse the relation to:
• Trace the relation.
• Find points of interest.
• Assign a variable in the expression to a slider.
Viewing the Table
▶ To display a table of values corresponding to the current plots, press b
> Table > Split-screen Table (b 7 1).
Using the Scratchpad 33

 Loading...


