Chapter 3
Pressing the Time x-axis label on the graph screen
switches between Time (s), Time (abs), and Time (rel).
Time (s): Elapsed time from first logged point (log
interval) to the last logged point (test length).
Time (rel): Relative time from zero to last logged point
(test length – log interval).
Time (abs): Absolute time from first logged point (test
start + log interval) to last logged point (test stop).
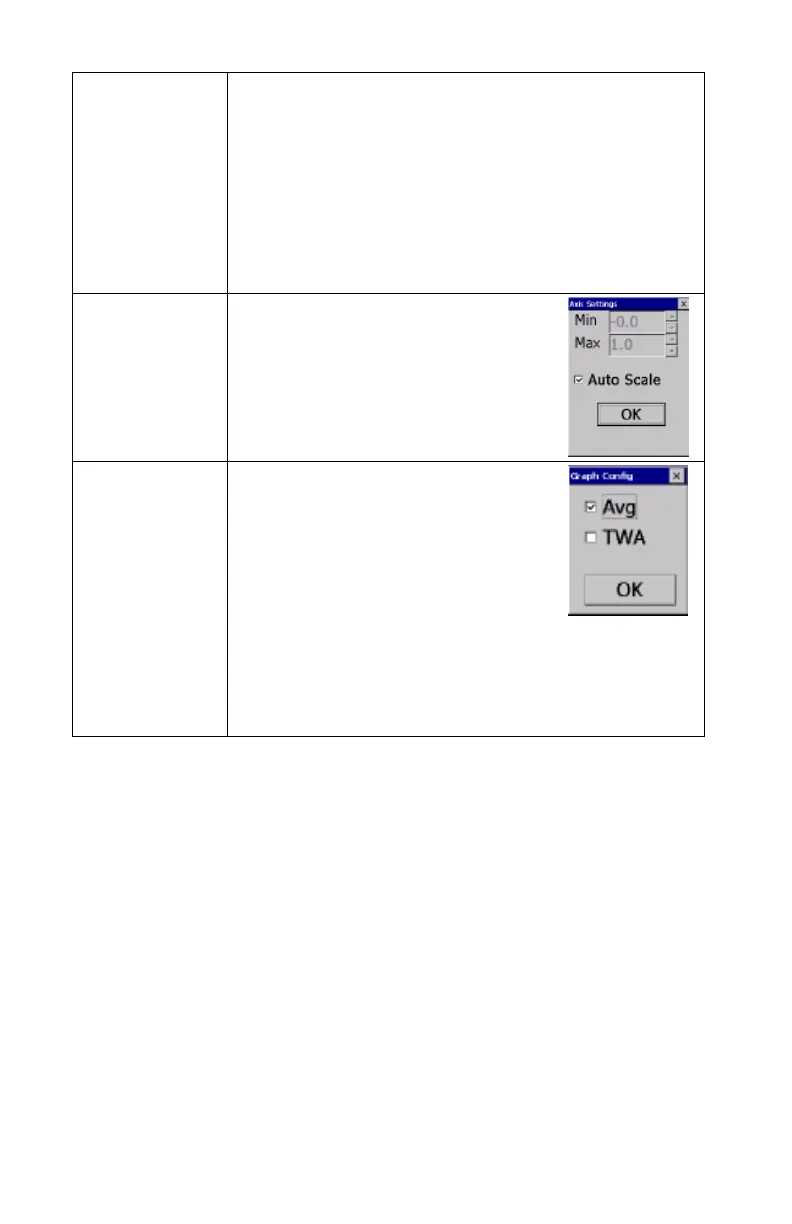
Pressing in the Scale Display area will
bring up a dialog that will allow
changing between auto scaling and
user scaling of the Y-axis.
Pressing the data region will bring up
a dialog to show TWA or Average
lines.
TWA: Will show a secondary line on
the graph showing the time weighted
average of the data. This line will not
show if test time is less than 15
minutes.
Average: Show a secondary line on
the graph of the running average of
the data.
In Graphing Mode, pressing Main returns the instrument to the Main Screen
display.
 Loading...