Ƹ
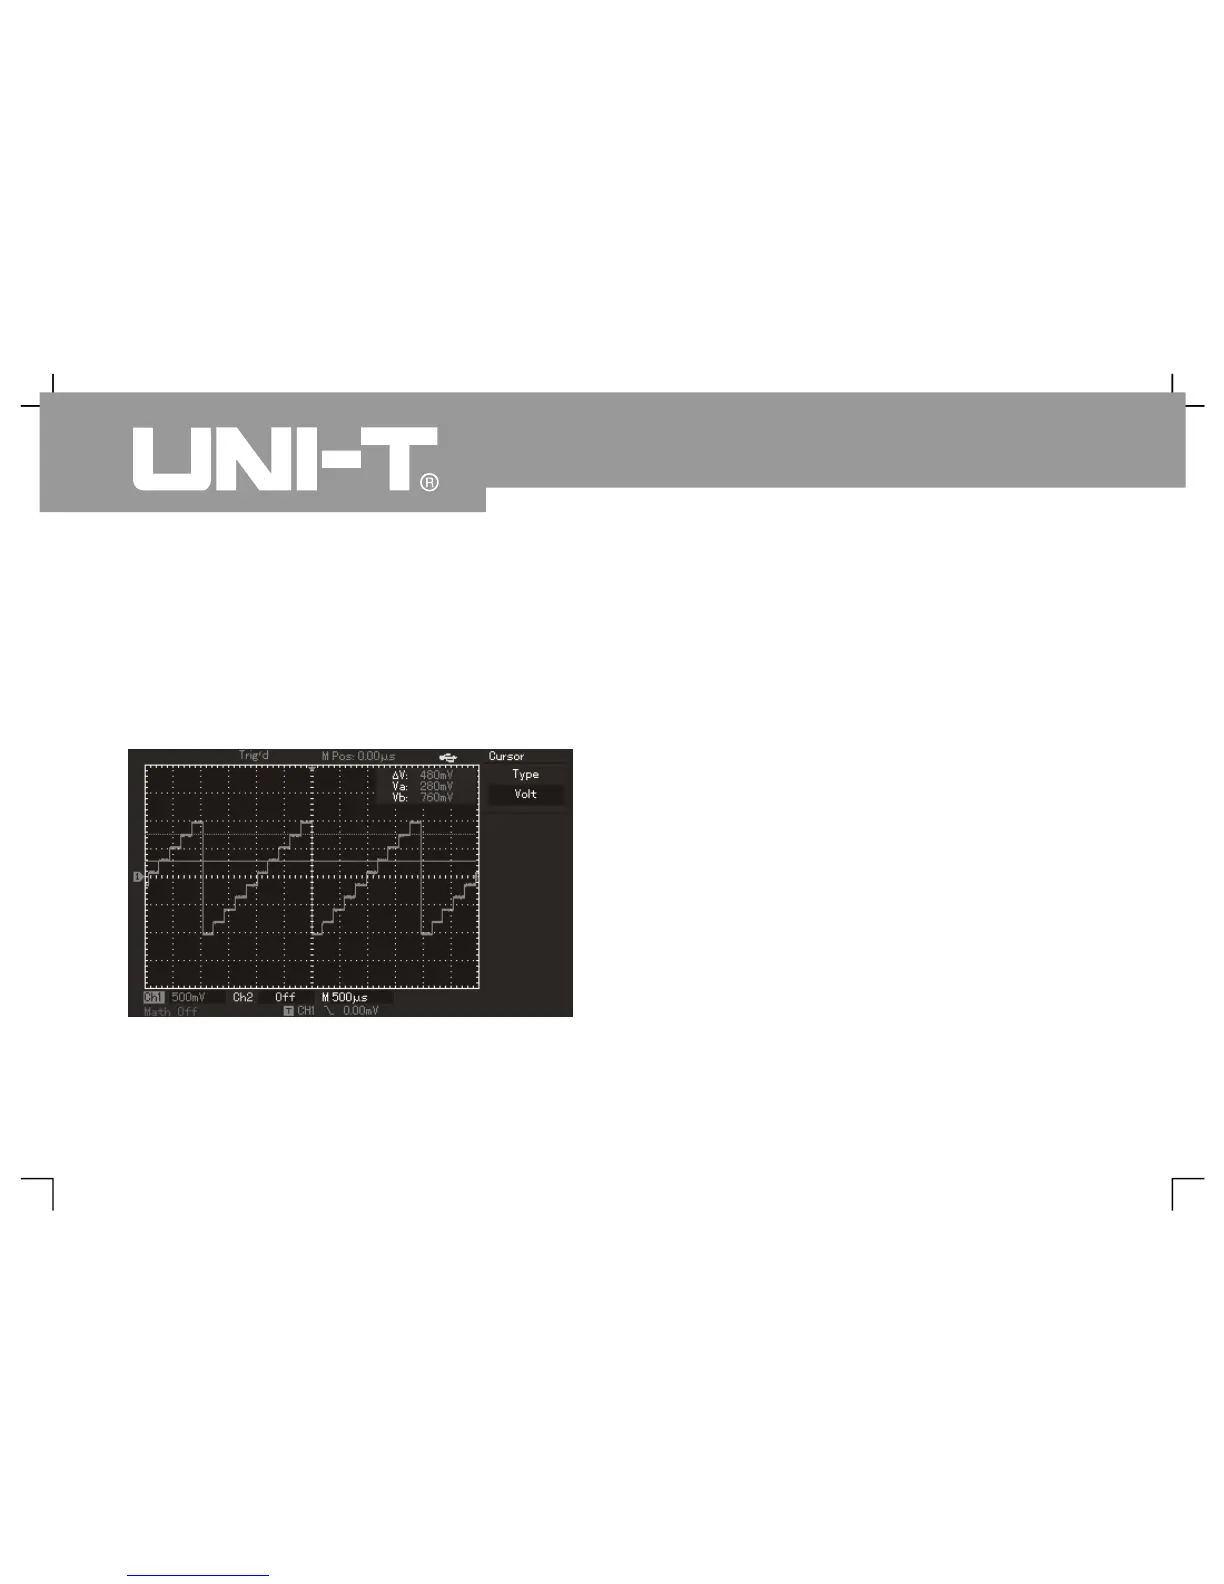
V namely pressure difference can be show
in cursor menu automaticall
Please refer to following figure for details
Note: Please set cursor type to time if onlyin
adopting the secondstep as above for time
measurement by cursor
Figure 3-6 Voltage difference of signal by cursor
measurement
To review phase location difference of signals of
Example: Phase location variation caused by 1
circuit for tested signals. Please connect digital
storage oscillograph to cir cuit to monitor
input/output signal of circuits. Please operate
according to following steps to review input/output
terminal of circuits by way of X-Y coordinate
diagram
1. To set probe menu attenuation coefficient to 10*
and s et switch on the probe to 10*
2. To connect CH1 probe to network input the
connect Ch2 probe to network output
3. To press CH1 and CH2 menu keys and open
channels if they have not been displayed
5. To adjust vertical scale knob for approximate
equivalent display amplitude of 2 loops of signals
The sixth example: Application of X-Y function
Oper ating Man ual for UTD2000/ 3000
 Loading...