2-10
IM 04L51B01-01EN
2.2 Configuration of Measured Data Display
This section explains how to display various measured data.
2.2.1 Displaying Measured Data Using Waveforms, Numeric Values, Bar
Graph,orCustomDisplay(/CGoption)(Trend,digital,bargraph,and
customdisplays)
Procedure
Displaying the Trend, Digital, or Bar Graph Display
1
Press MENU.
The menu screen appears.
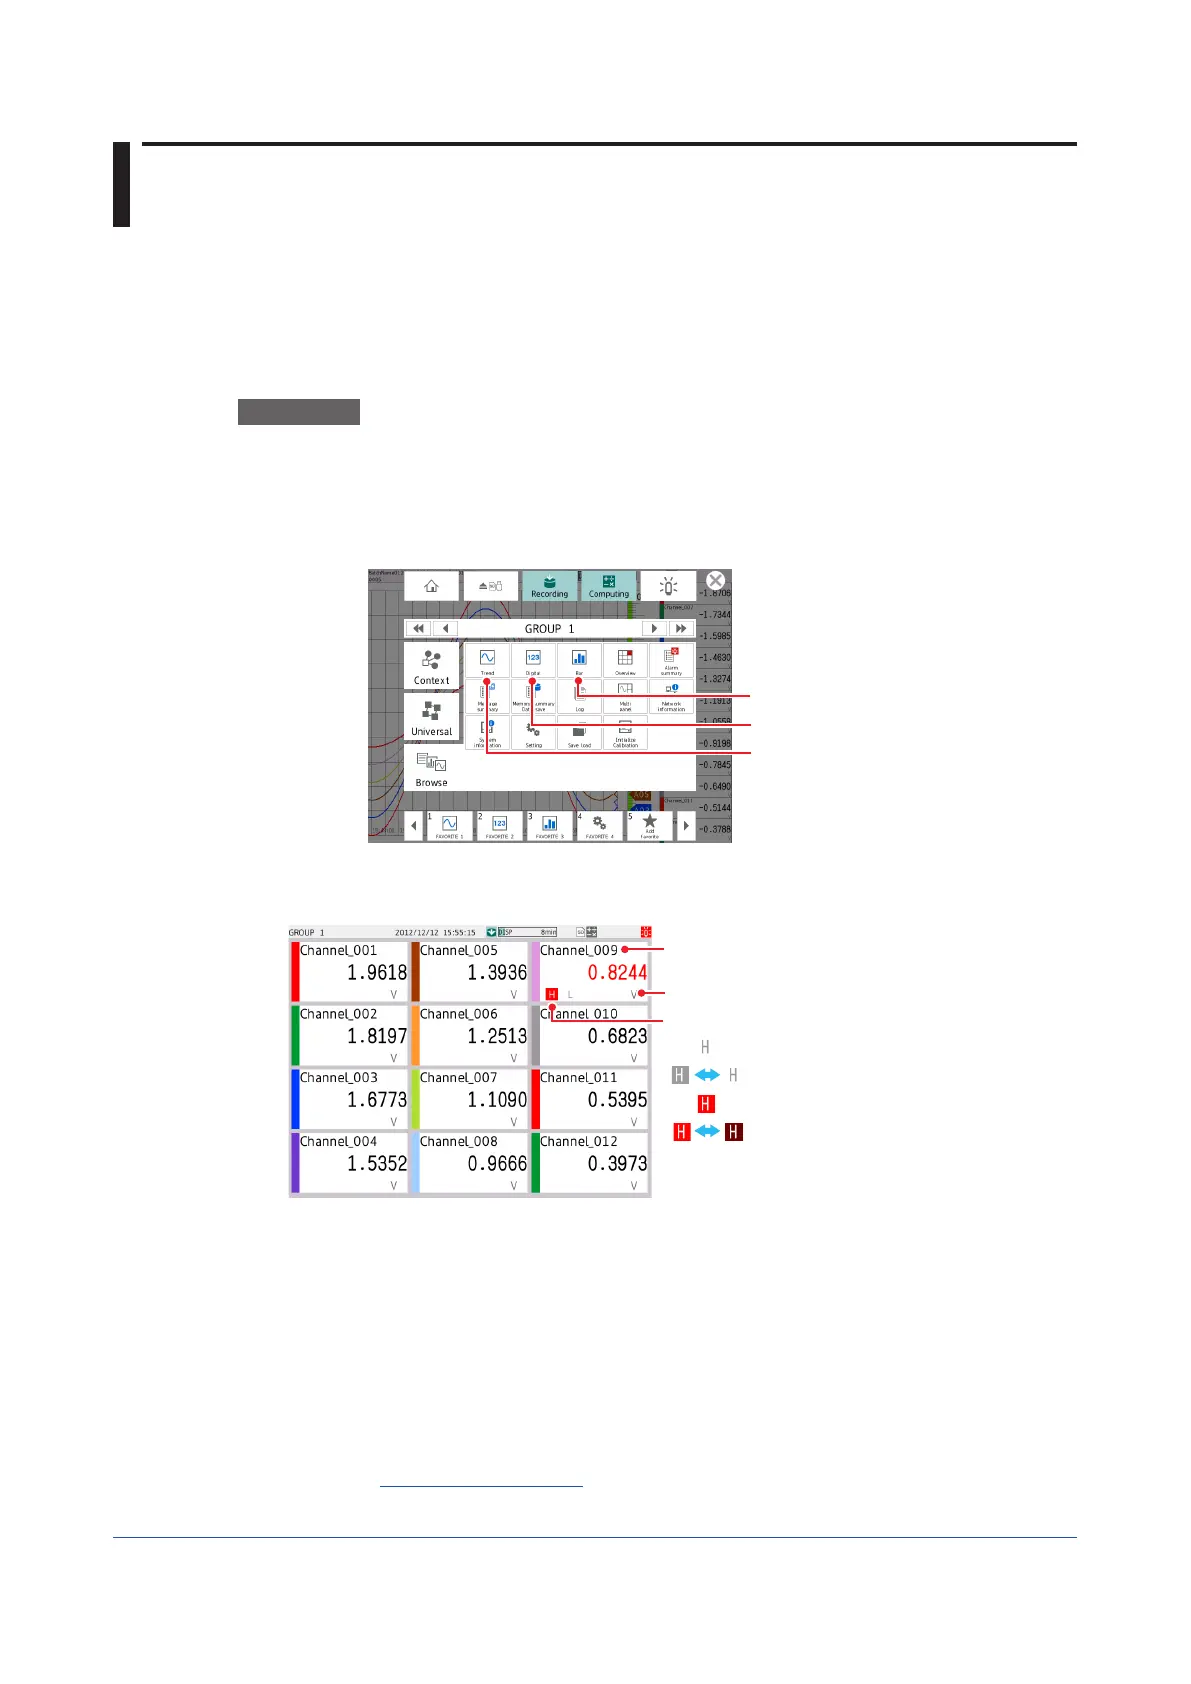
2
Tap the Browse tab.
Trend display
Digital display
Bar graph display
3
Tap Trend, Digital, or Bar graph.
The display that you selected appears.
Blinking
No alarms; all acknowledged
No alarms; some not acknowledged
Alarms present; some not acknowledged
Alarms present; all acknowledged
Channel number or tag
Unit
Alarm mark
GX20 digital display example
PrecedenceinDisplayingTags(Charactersandnumbers)
Tag numbers are displayed with higher precedence than tag characters.
When tag numbers are not assigned, tag characters are displayed.
If neither the tag numbers nor tag characters are assigned, channel numbers are
displayed.
Maximum Number of Channels That Can Be Displayed in a Group
GX20/GP20: 20 channels
GX10/GP10: 10 channels
Operation complete
 Loading...