11 Fuel level
The horizontal bars indic-
ate the quantity of fuel left
in the tank. The top bar
is larger than the others
and the quantity of fuel it
represents is significantly
larger.
12 Bottom values area
13 Warning, in combination
with a text ( 25)
Meaning of symbols
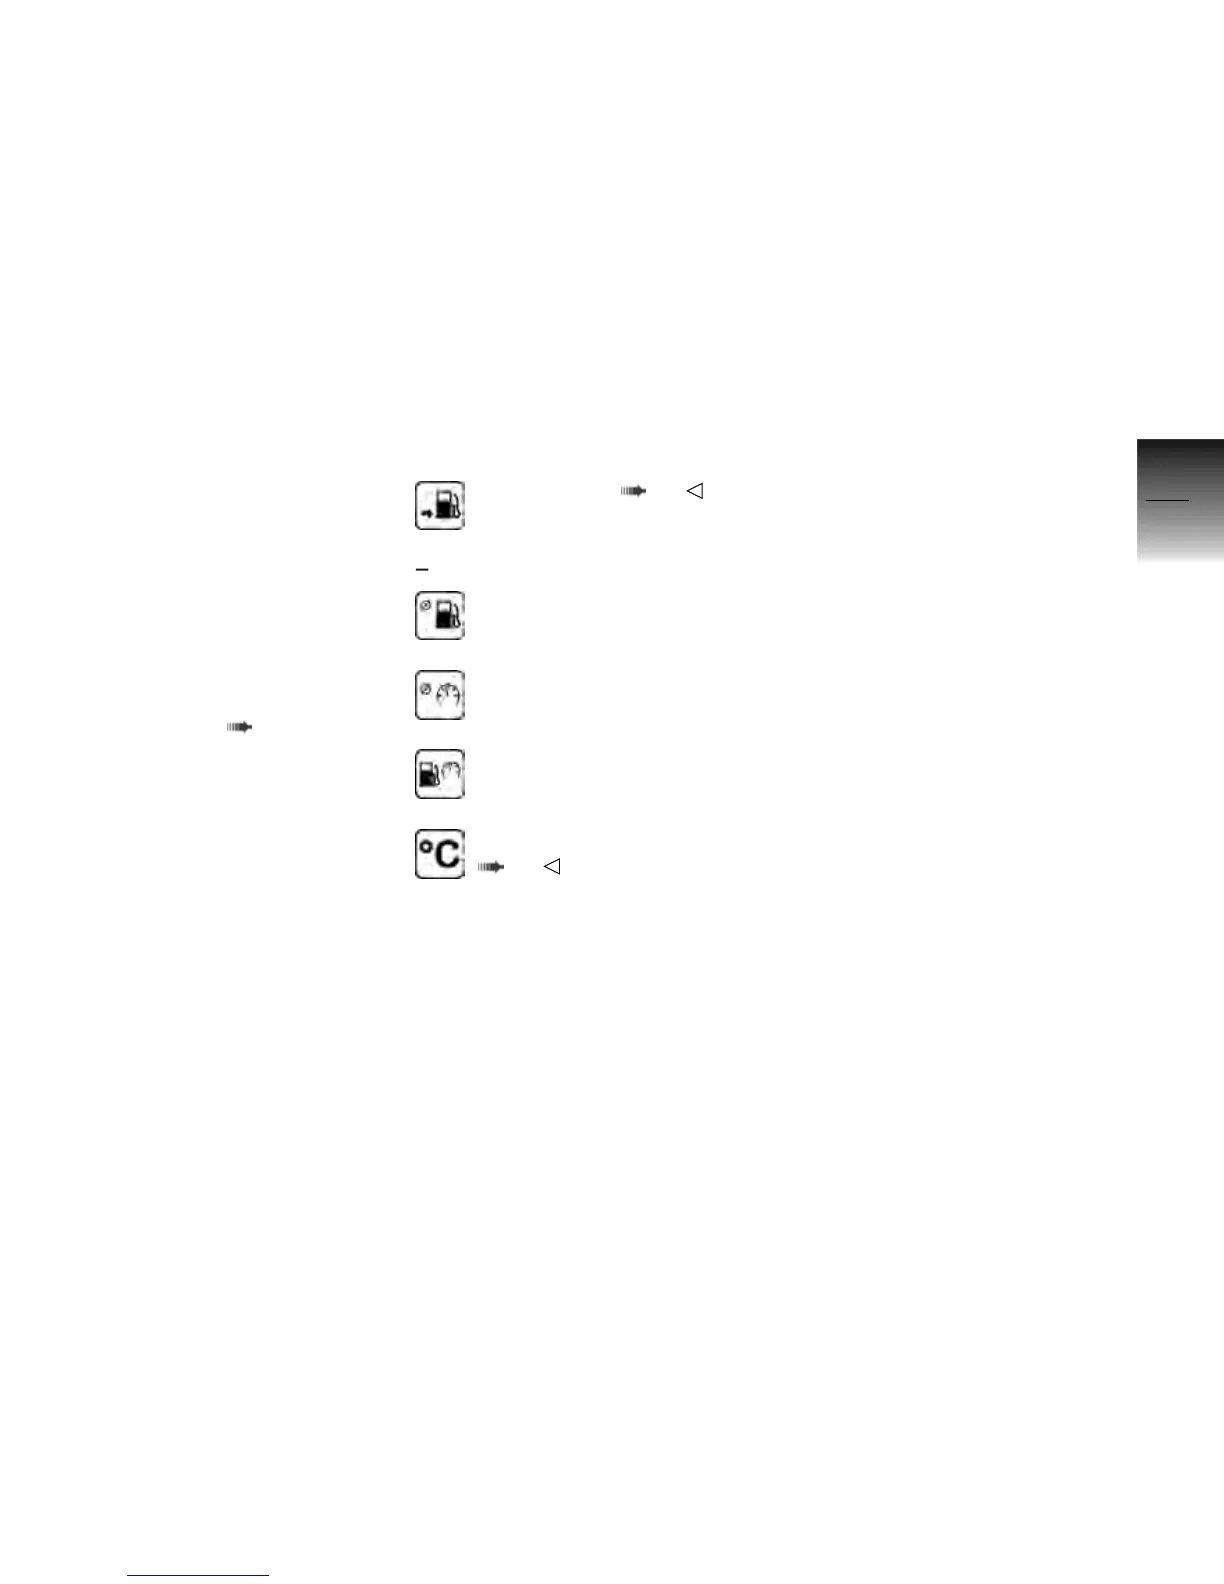
Range in km ( 23)
with on-board computer
OE
Average consumption in l/
100 km
Average speed in km/h
Current consumption in l/
100 km
Ambient temperature in °C
( 24)
3
21
z
Status indicators