Section 1 - Ventilation
Honeywell Economizers 63-8594-02 14
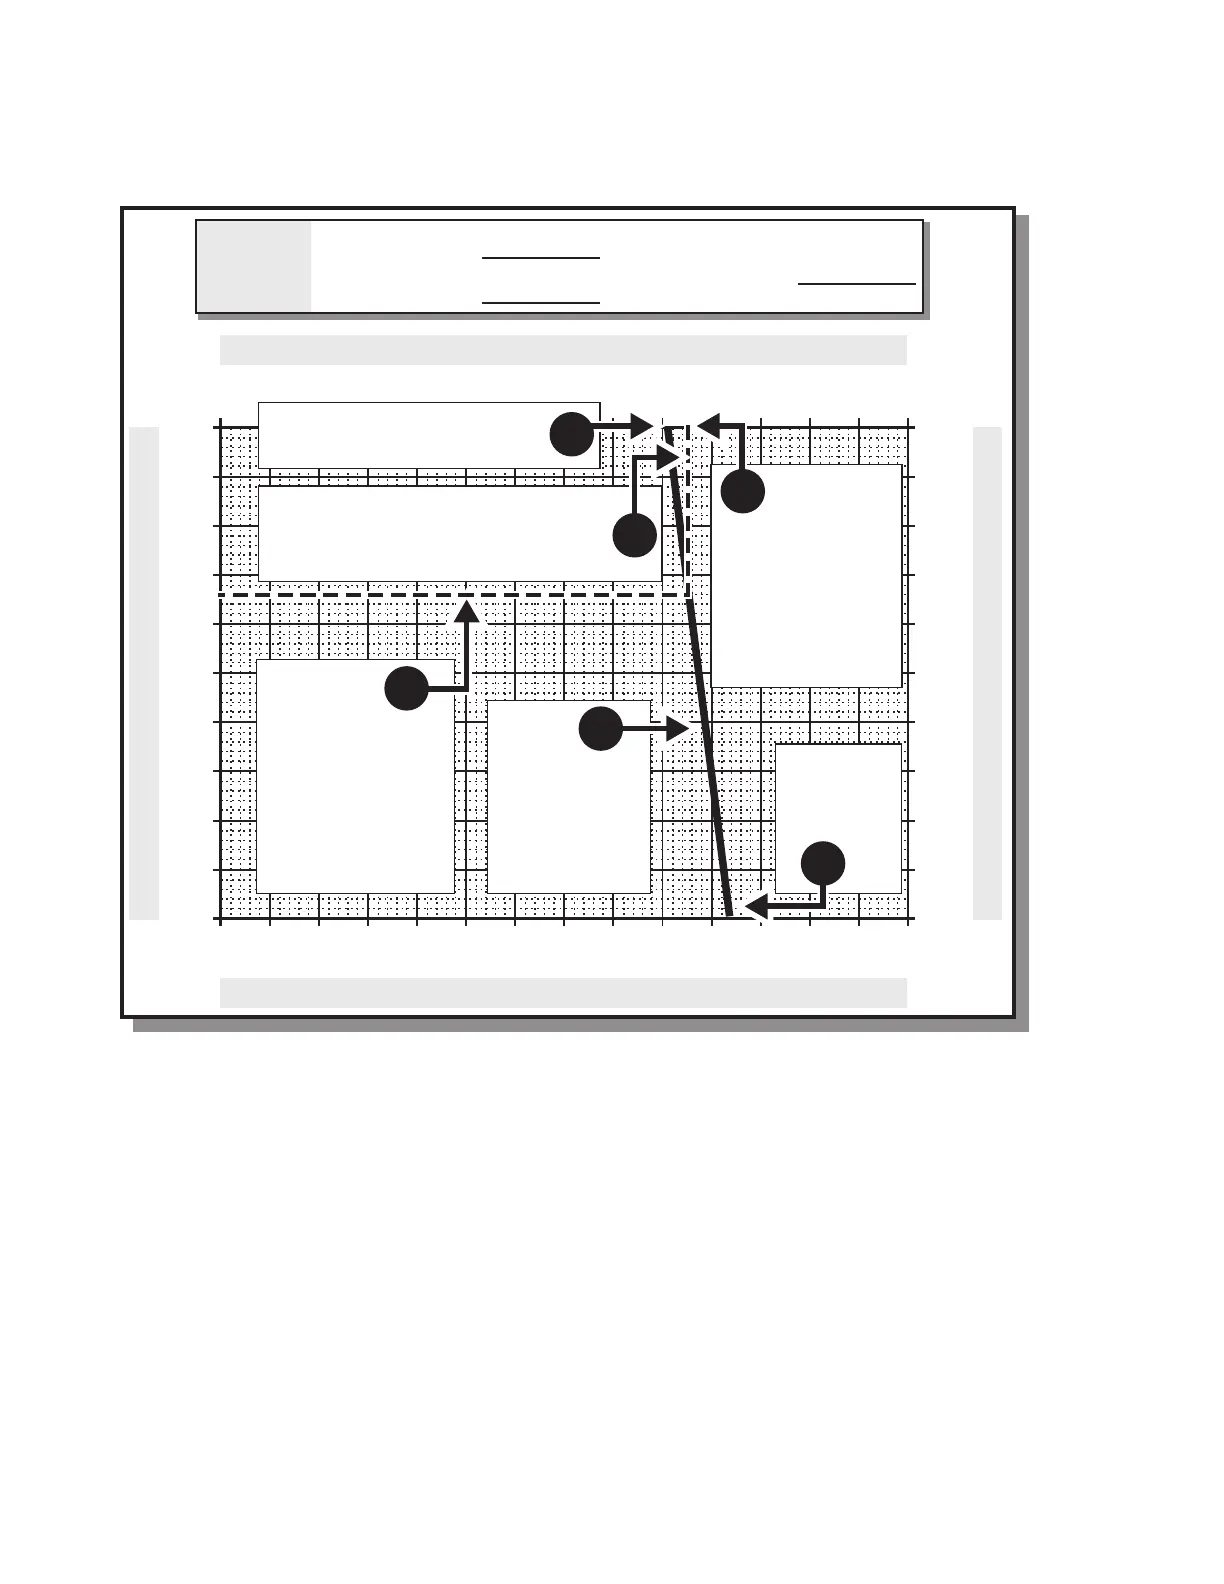
Example 2: Use of Outside Air Chart on a Warm Day
The chart can also be used on a warm day
when the outside air temperature exceeds
both the return and the mixed air
temperatures. The first line drawn will slant in
a different direction. Once again it is best to do
this test when there is a minimum of 10
degrees F difference between the outside and
return air.
OUTSIDE AIR TEMPERATURE
MIXED and RETURN AIR TEMPERATURES
0%
10%
20%
30%
40%
50%
60%
70%
80%
90%
100%
0%
10%
20%
30%
40%
50%
60%
70%
80%
90%
100%
%
O
U
T
S
I
D
E
A
I
R
%
O
U
T
S
I
D
E
A
I
R
49 C
120 F
43
110
38
100
32
90
27
80
21
70
16
60
10
50
4
40
-1
30
-7
20
-12
10
-18
0
-23
-10
-29 C
-20 F
120 F
49 C
110
43
100
38
90
32
80
27
70
21
60
16
50
10
40
4
30
-1
20
-7
10
-12
0
-18
-10
-23
-20 F
-29 C
Measure the return air
temperature.
1
Measure the
outside air
temperature.
2
Draw a line
from the return
air on top to the
outside air on
the bottom.
3
Measure the mixed
air temperature.
This should be
done in 4 or more
locations and
averaged.
4
Draw a line straight down from the
mixed air temperature till it intersects
the line that was just drawn.
At the point of
intersection draw a
line to the left till
the percentage of
outside air is
indicated.
6
71 F (22 C)
RETURN AIR TEMP
MIXED AIR TEMP
OUTSIDE AIR TEMP
OUTSIDE
AIR
CHART
75 F
(24 C)
84 F (29 C)
5
M25276A
 Loading...