8-20 Statistics aplet
Exploring the graph
The Plot view has menu keys for zooming, tracing, and
coordinate display. There are also scaling options under
>9,(:6@. These options are described in“Exploring the graph”
on page 2-7.
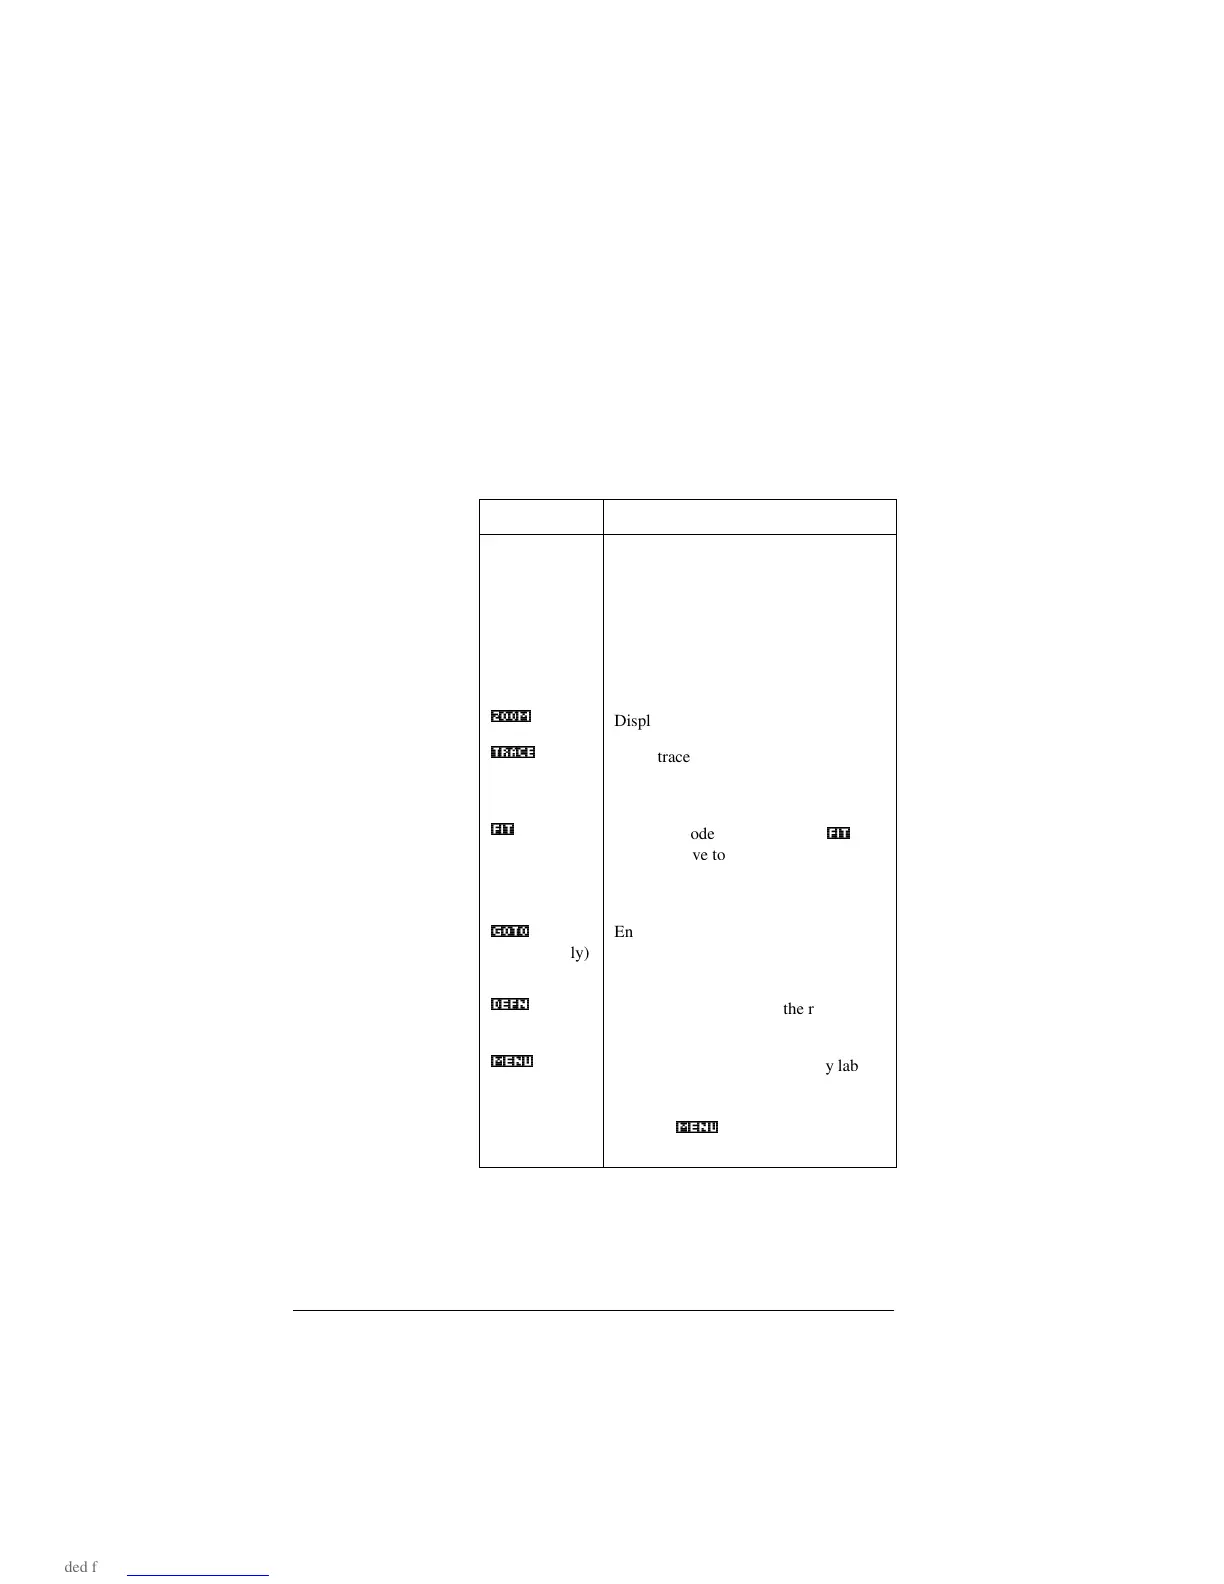
Statistics aplet’s PLOT view keys
Key Meaning
>6+,)7@CLEAR Erases the plot.
>9,(:6@ Offers additional pre-defined views for
splitting the screen, overlaying plots,
and autoscaling the axes.
>6+,)7@*>,
>6+,)7@*A,
Moves cursor to far left or far right.
=220_
Displays ZOOM menu.
75$&(_
Turns trace mode on/off. The white box
appears next to the option when Trace
mode is active.
),7_
Turns fit mode on/off. Turning
),7_
on
draws a curve to fit the data points
according to the current regression
model.
*272_
(2var
statistics only)
Enables you to specify a value on the
line of best fit to jump to or a data point
number to jump to.
'()1_
Displays the equation of the regression
curve.
0(18_
Hides and displays the menu key labels.
When the labels are hidden, any menu
key displays the (x,y) coordinates.
Pressing
0(18_
redisplays the menu
labels.

 Loading...