Statistics aplet 8-5
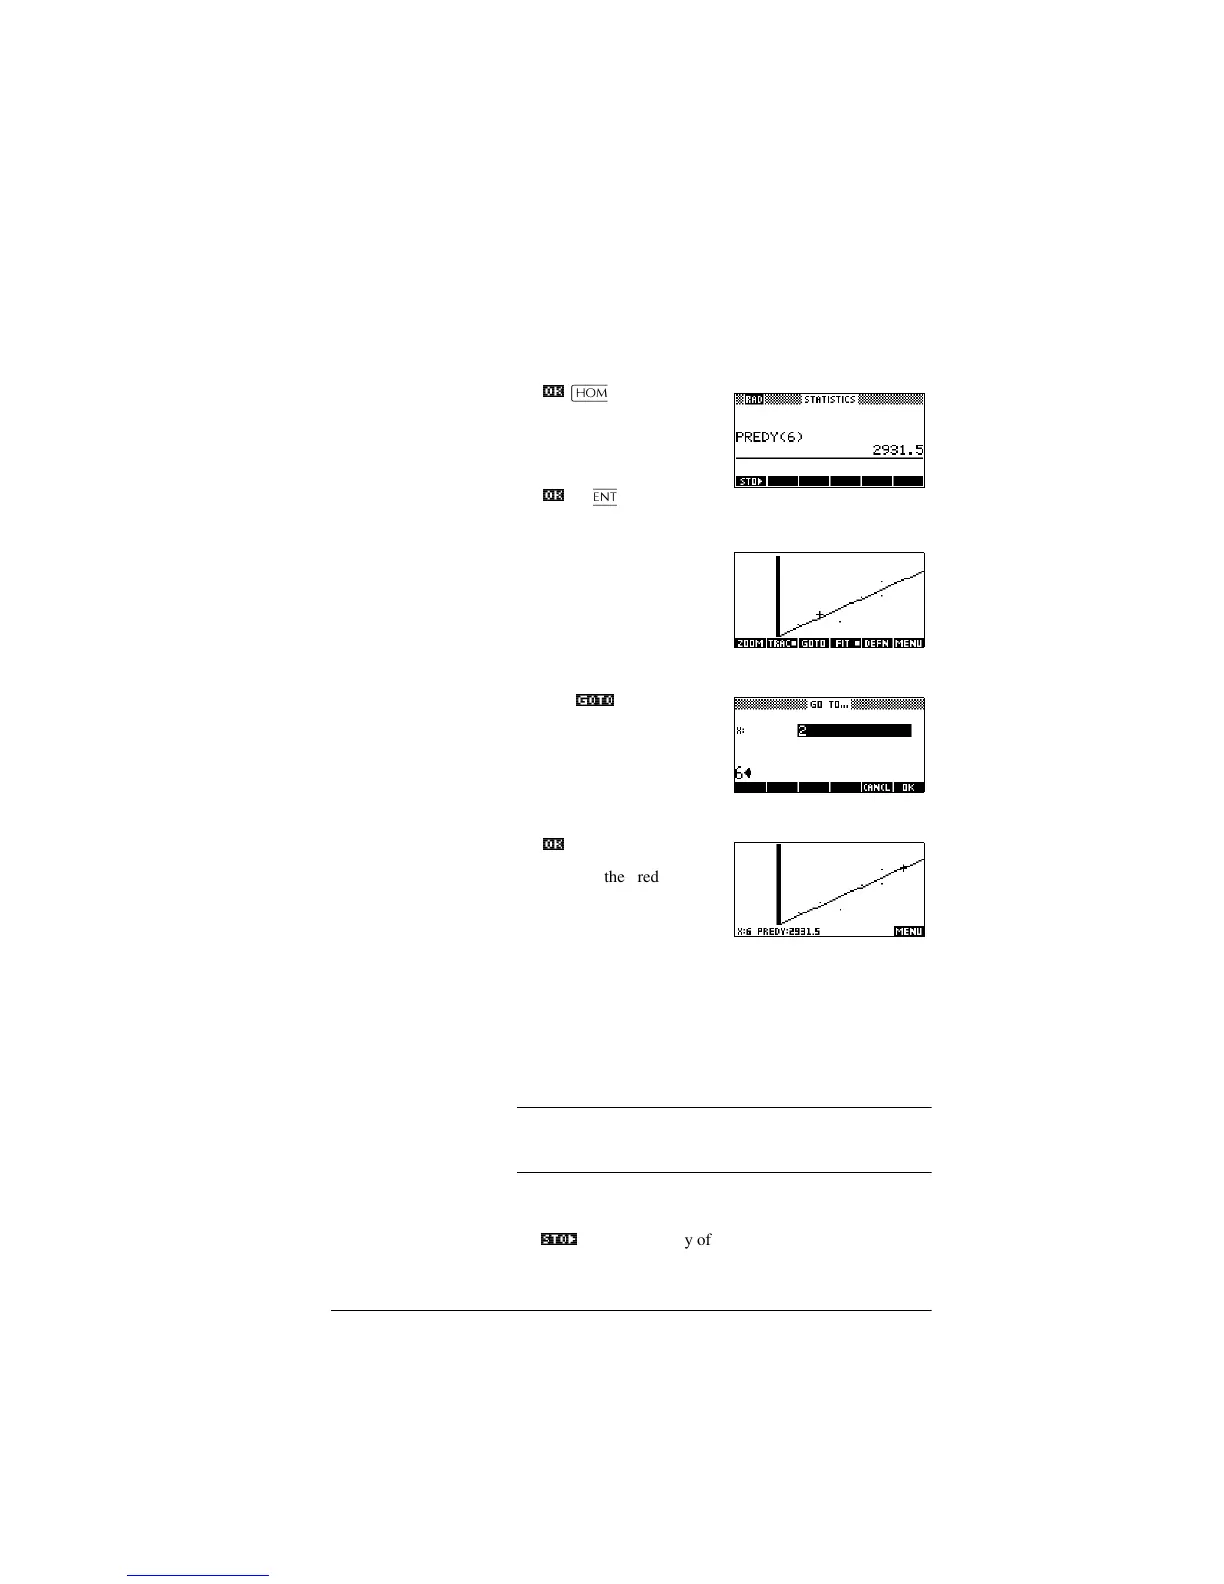
Predict values 13. To find the predicted sales figure if advertising were to
go up to 6 minutes:
2._
>+20(@
>0$7+@ S (to highlight
Stat-Two)
*A,*e, (to highlight
PREDY)
2._
6>(17(5@
14. Return to the Plot view.
>3/27@
15. Jump to the indicated point on the regression line.
*e,
*272_
6
2._
Observe the predicted y-
value in the left bottom
corner of the screen.
Entering and editing statistical data
The Numeric view (>180@) is used to enter data into the
Statistics aplet. Each column represents a variable named C0
to C9. After entering the data, you must define the data set in
the Symbolic view (>6<0%@).
HINT
A data column must have at least four data points to provide
valid two-variable statistics, or two data points for one-
variable statistics.
You can also store statistical data values by copying lists from
HOME into Statistics data columns. For example, in HOME,
L1
672?_
C1 stores a copy of the list L1 into the data-column
variable C1.

 Loading...