Section 3: Numeric Functions 45
Linear Regression
Linear regression is a statistical method for finding
a straight line that best fits a set of two or more
data pairs, thus providing a relationship between
two variables. After the statistics of a group of data
pairs have been accumulated in registers R
0
through R
5
, you can calculate the coefficients in
the linear equation y = Ax + B using the least
squares method by pressing ´L.
To use the linear regression function on your HP-
10C, use the z key to accumulate the statistics
of a series of two or more data pairs. Then execute L. When you press
´L:
1. The contents of the stack registers are lifted as they are when you press
´’, as described on page 43.
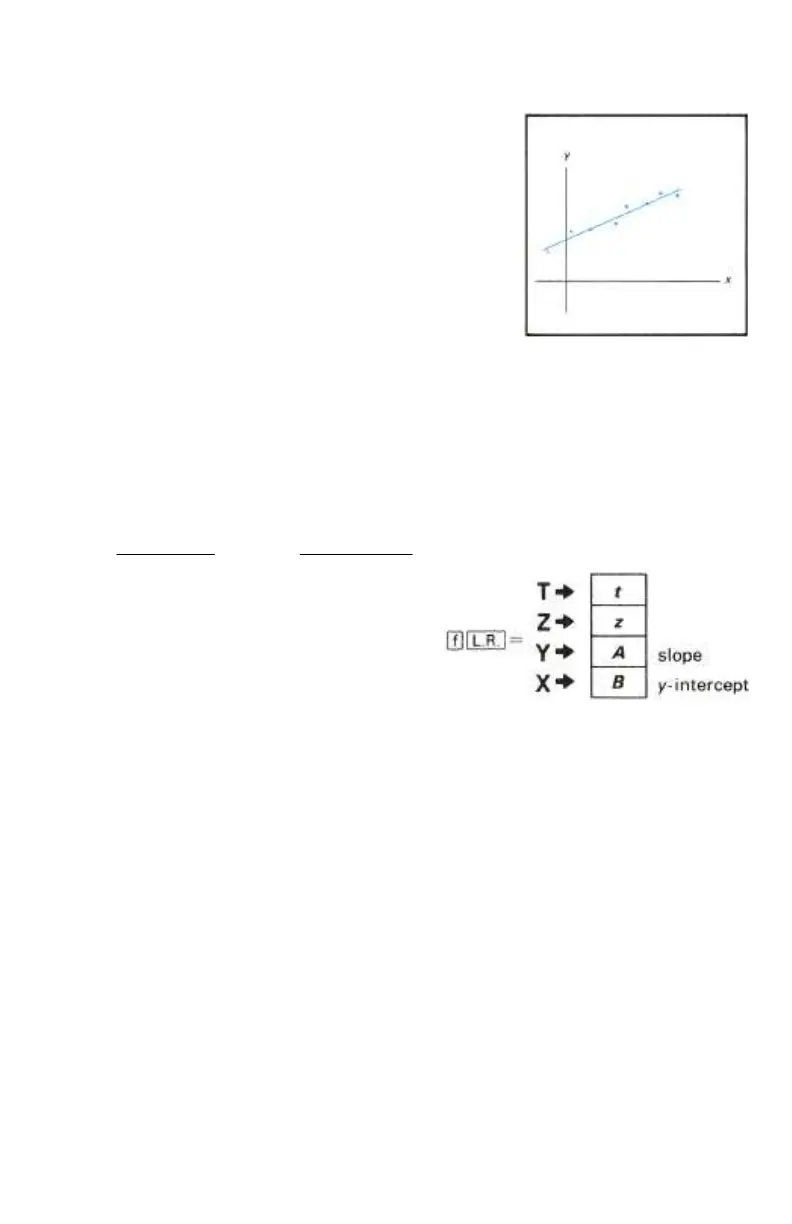
2. The slope (A) and the y-intercept (B) of the least squares line of the
data are calculated using the equations:
22
2
22
)()( xxn
xyxxy
B
xxn
yxxyn
A
Σ−Σ
ΣΣ−ΣΣ
=
Σ−Σ
ΣΣ−Σ
=
The slope A is placed in the Y-register;
the y-intercept, B, is placed in display (X-
register).
Example: Calculate the y-intercept and
slope of Voltz's corrected data.
Solution: Voltz could draw a plot of coal production against electrical output
like the one shown below. However, with her HP-10C, Voltz has only to
accumulate the statistics (as we have already done) using the z key, then
press ´L.
 Loading...