User’s manual
Viewing the system 17
Inim Cloud: This function becomes available via:
Home > select one of the available control panels
5.2 Visualization of the events log
The Log button (paragraph 3.3), accessible at level 1, accesses a section which contains all the events saved to the
system memory.
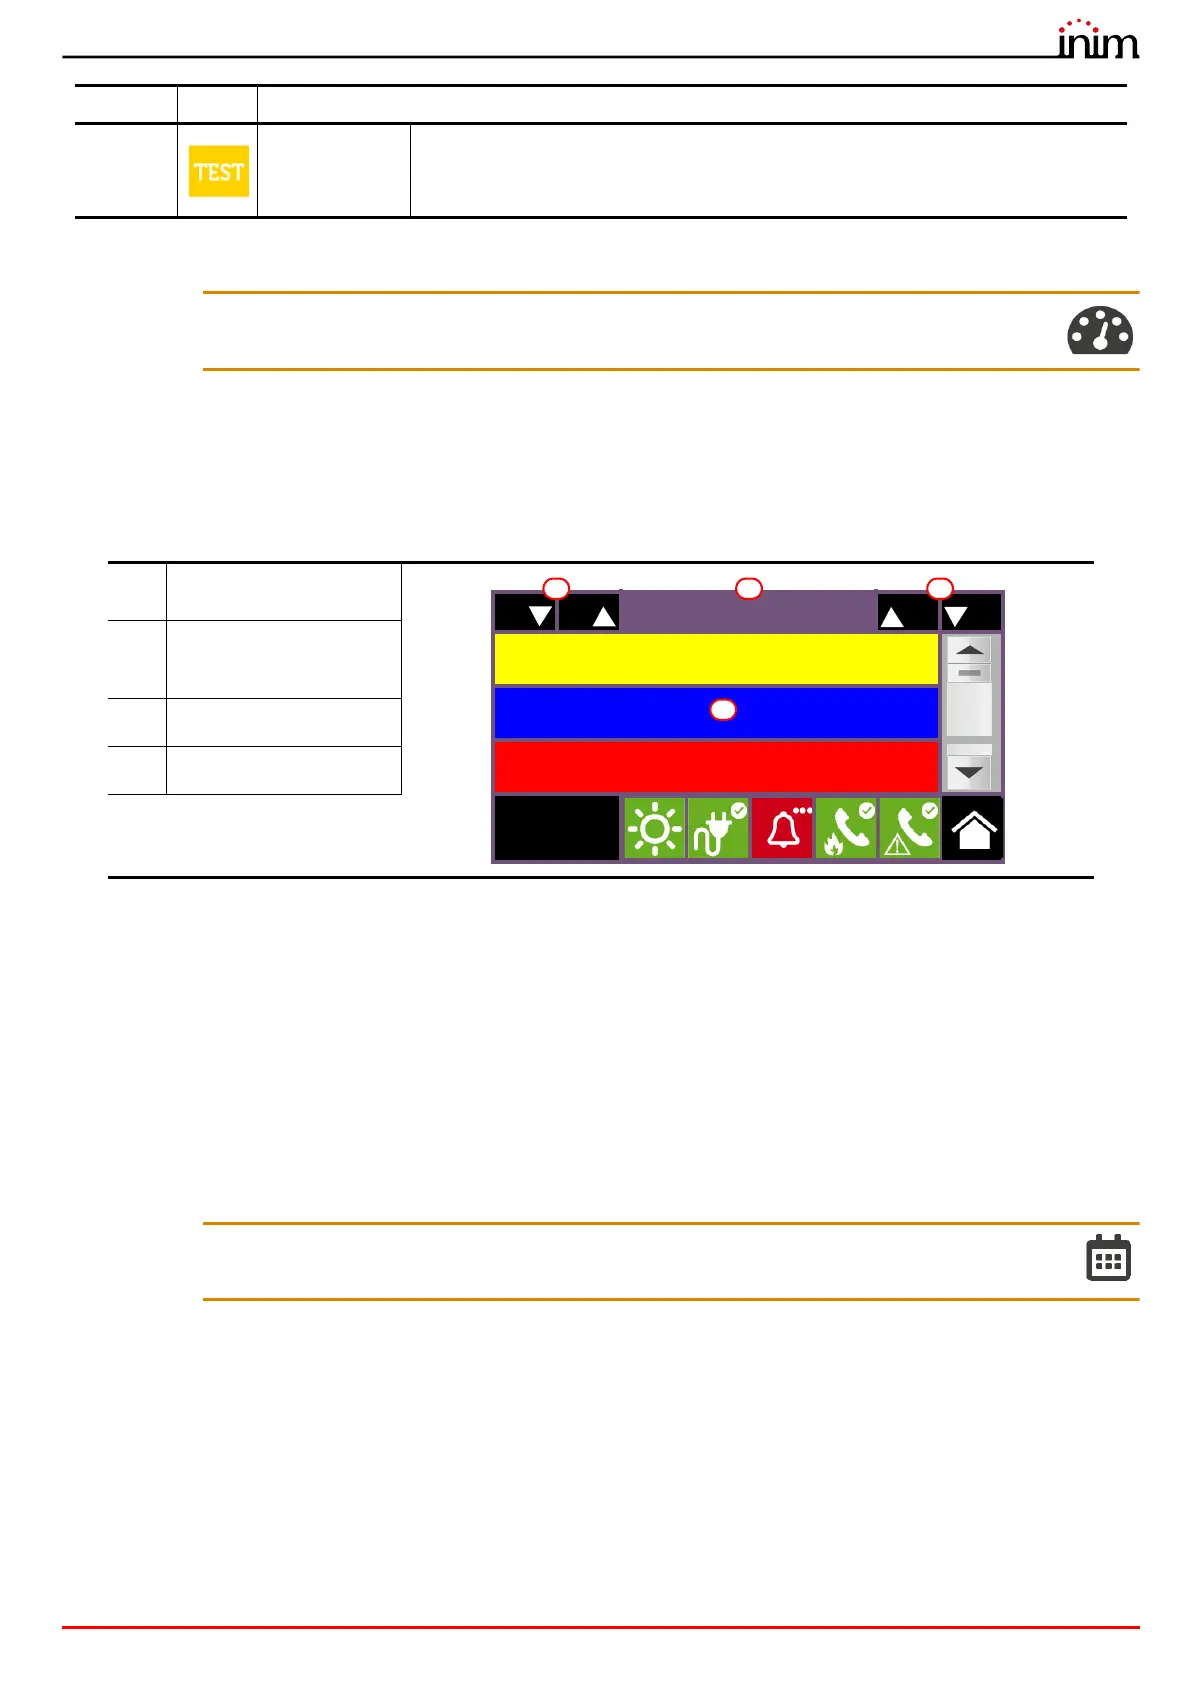
Each line in the list [D] represents an event which has been saved to the log.
For each event, the event report shows the date and time of its occurrence, the control panel on which it occurred (in
the case of several control panels in a network), the description of the event and other related details. It is possible to
distinguish the event type by the background colour of the line:
• White, indicates events relating to normal operating status
• Red, indicates events relating to alarm status
• Yellow, indicates events relating to fault status
• Blue, event selected by tapping on the screen
In the case of an event generated by a loop device, you access the management page via the device itself (refer to
paragraph 6.2 Device management).
Inim Cloud: This function is available by using the quick viewing buttons (paragraph 4.1 - [C]) or by going to:
Manage System > Events log
8Test
These signals indicate that at least one of the system elements is in test status.
This condition, to be applied during maintenance operations, maintains parts of the
system in non-operative status, therefore, putting the premises in danger as the
protection level of the system is reduced.
[A]
Keys for scrolling the
events in the log
[B]
54/5000Number of the
selected event out of the
total events
[C]
Scrolling keys (100 events)
[D]
Events list
Priority Icon Category
100 100
149/150
01/01/2020 18:21
Optical detector
Zone 1
Lost
PREVIDIA COMPACT
Loop 1 - Point 6
01/01/2020 18:22
User Code
RECOGNIZED CODE
PREVIDIA COMPACT
01/01/2020 18:23 EVACUATE
PREVIDIA COMPACT
Access level:1
C AB
D
 Loading...